Project 1 – Data Visualization
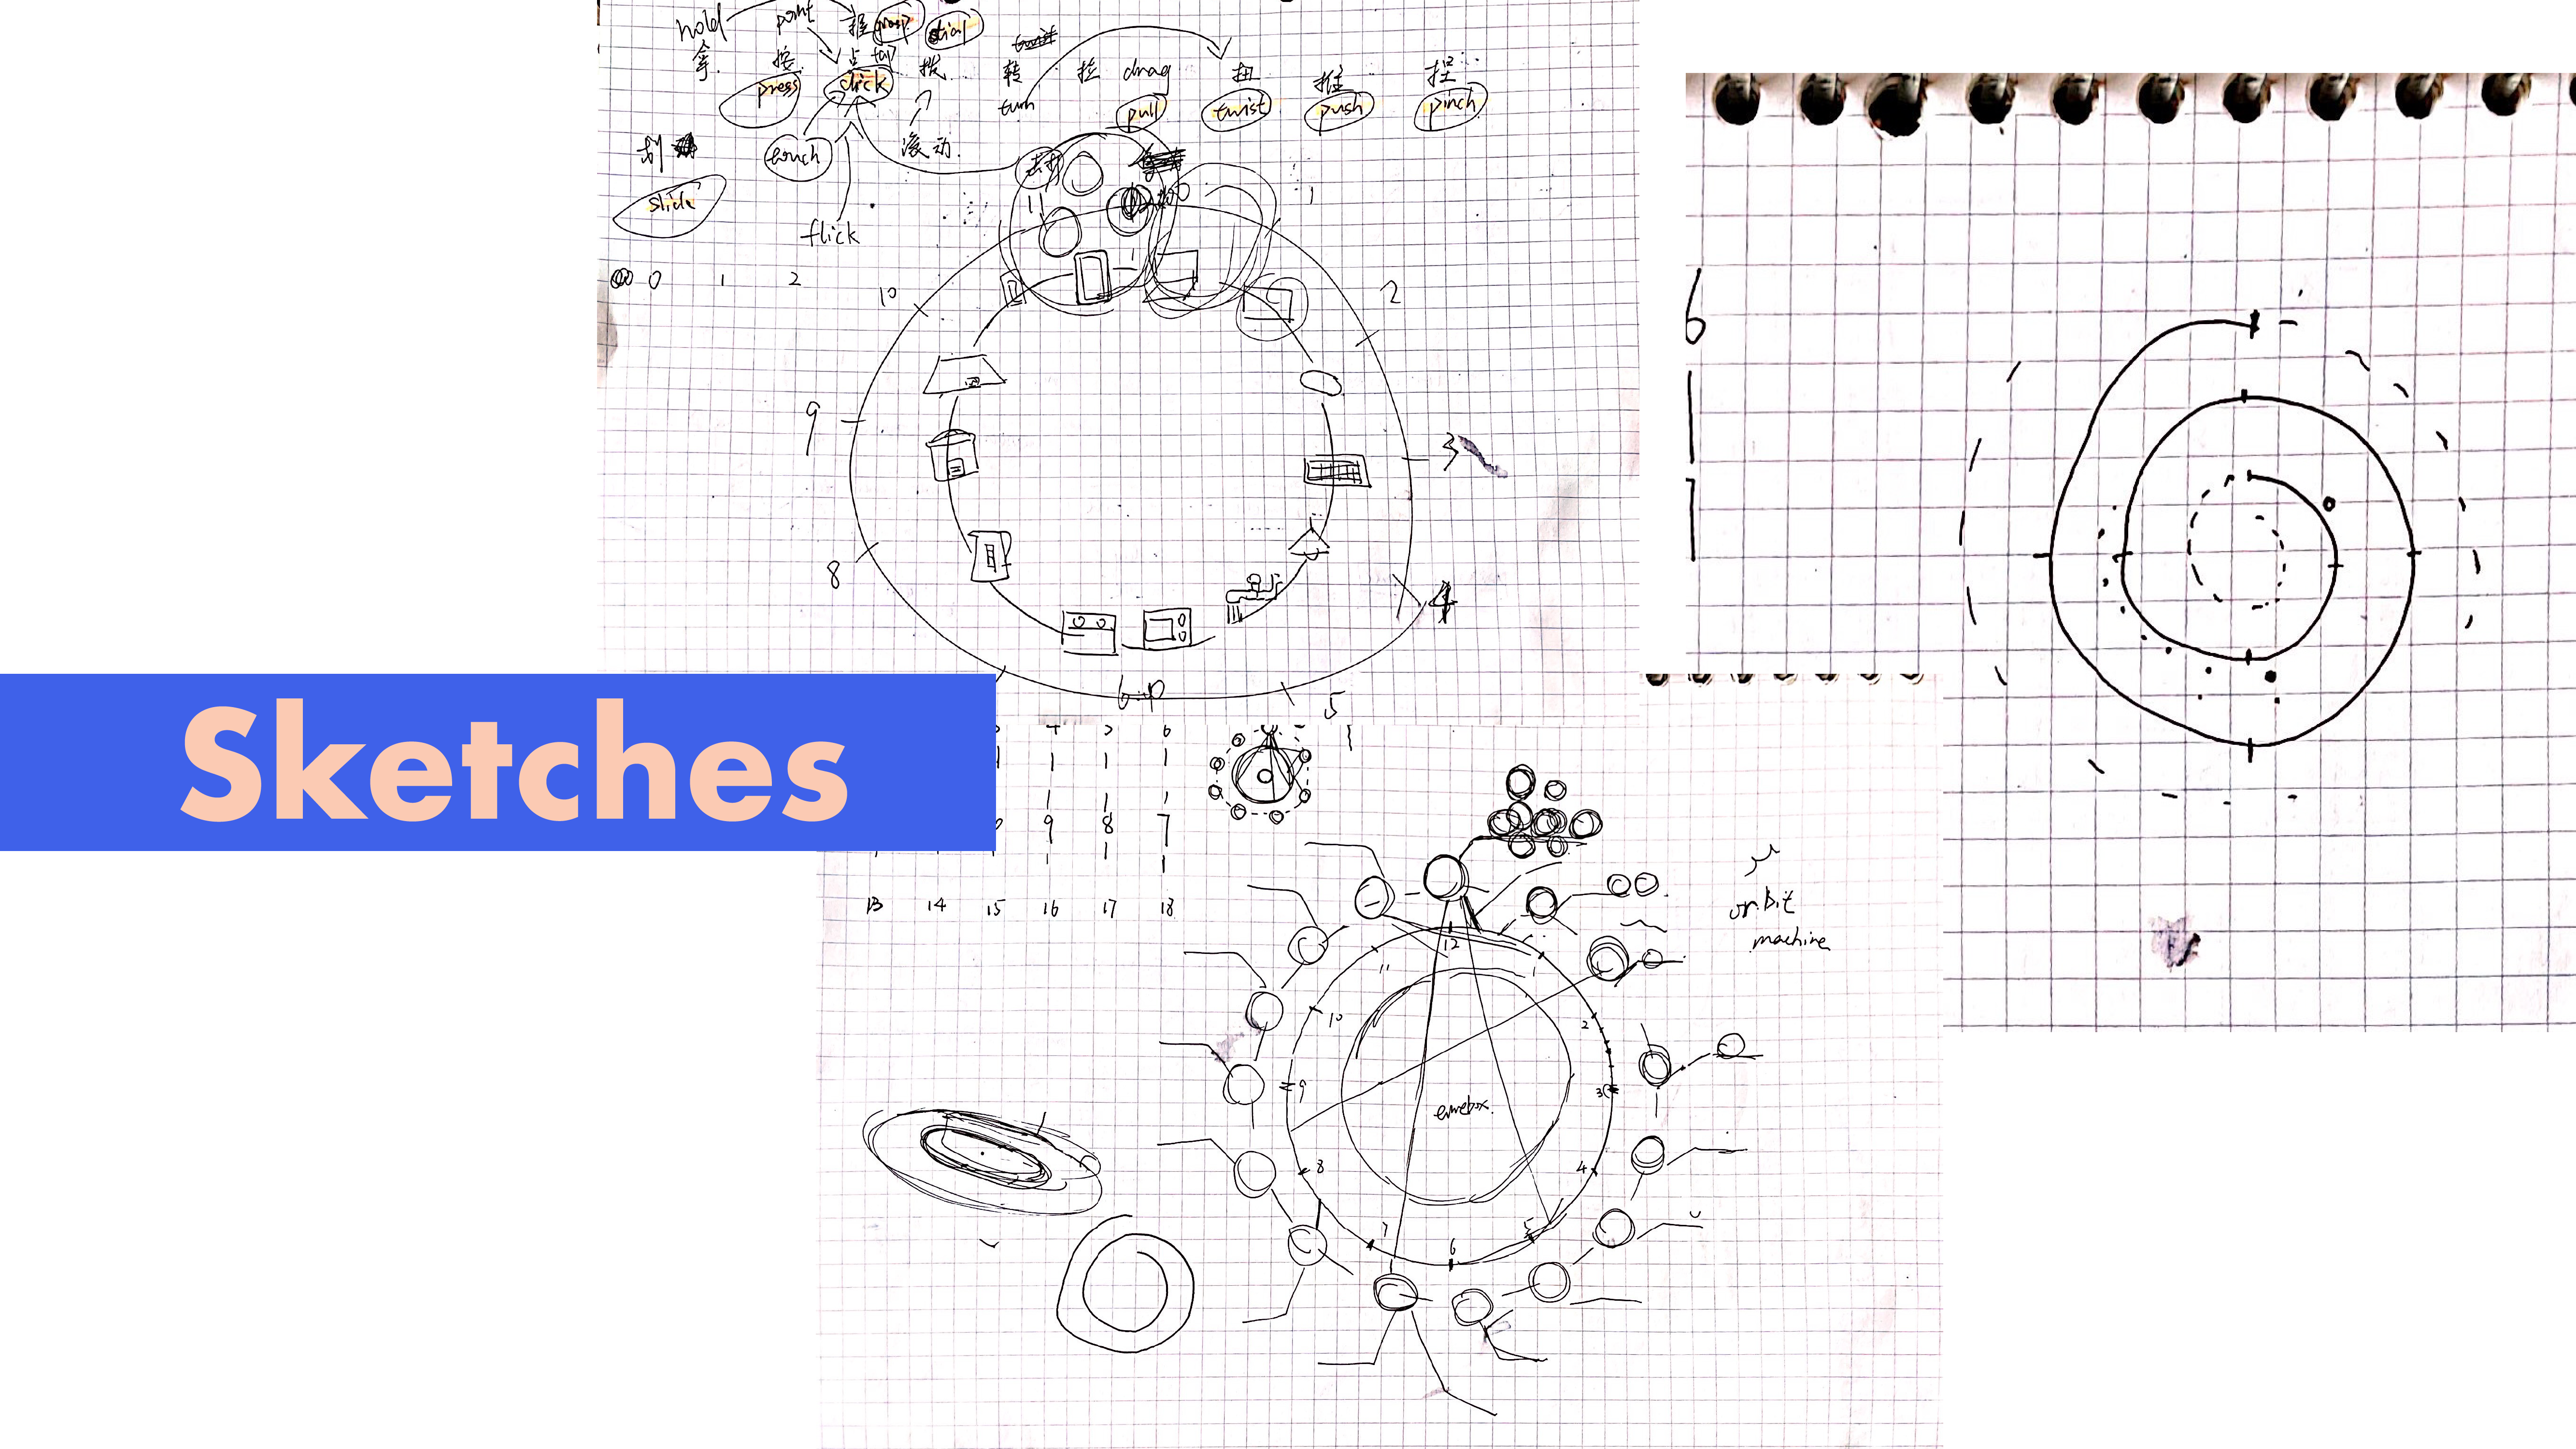
1. Choose the Theme
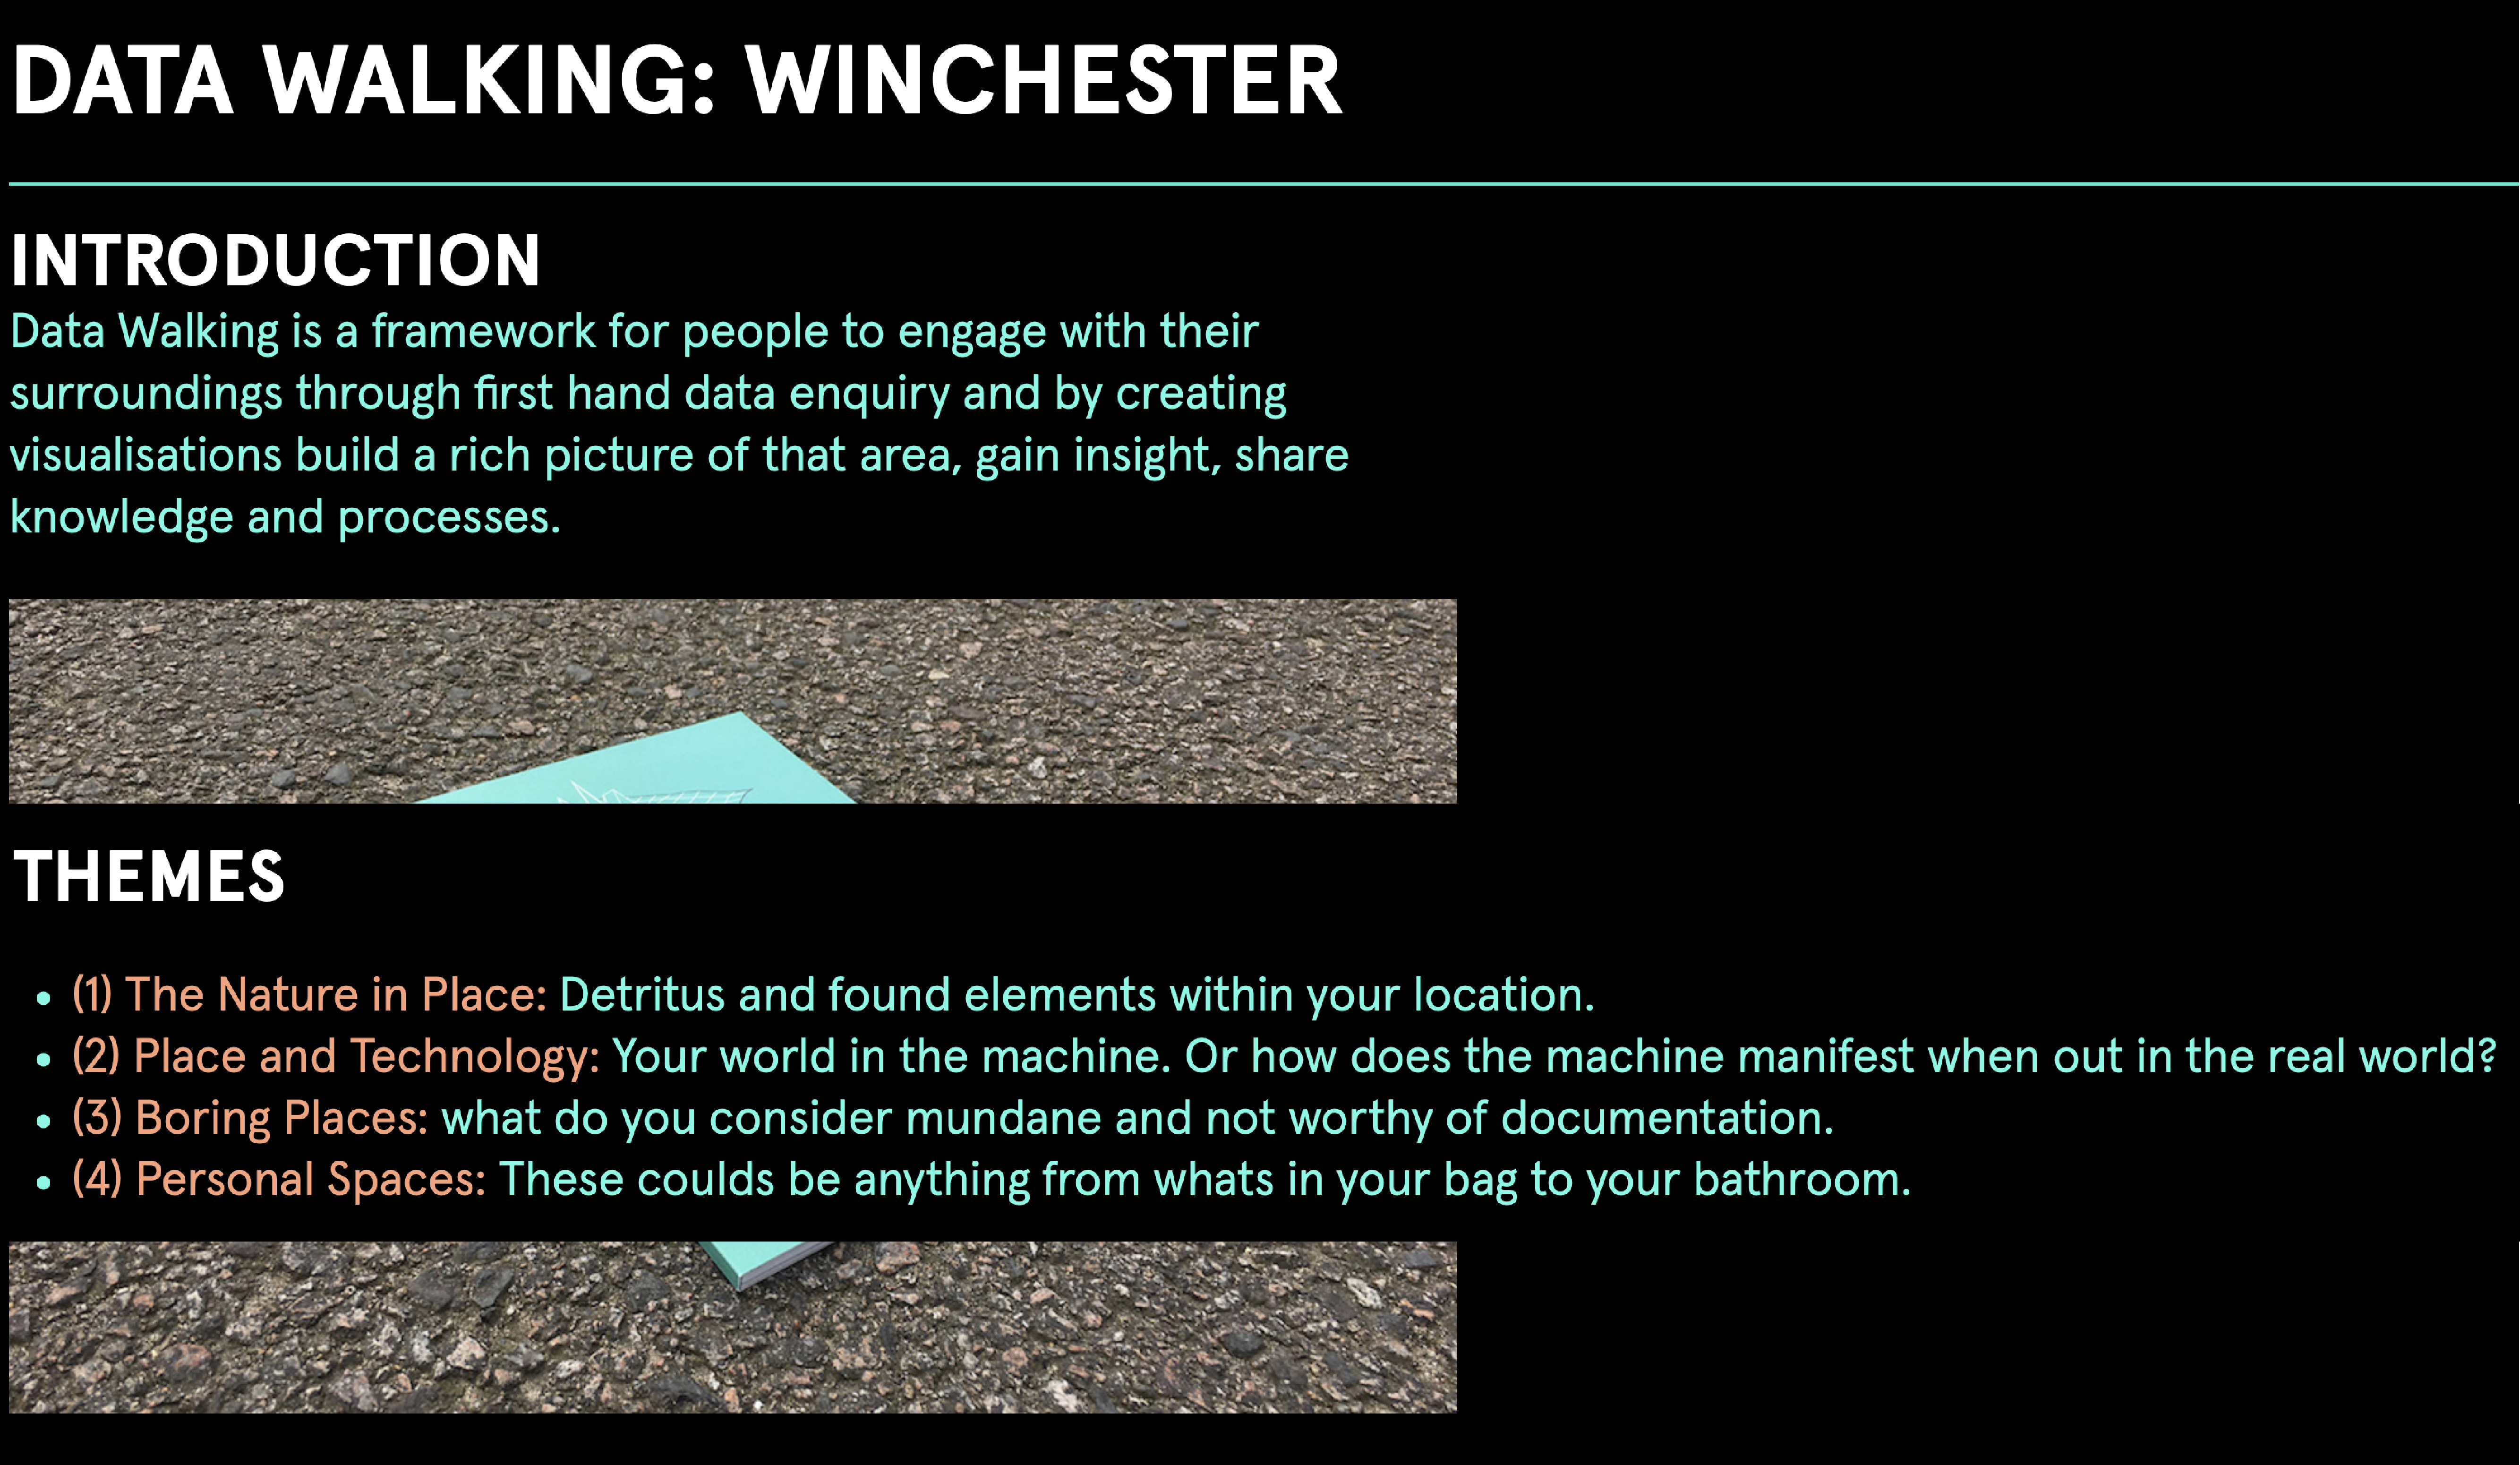

In the workshop on Data Walking, I walked out and counted some machines I have seen along the way. People’s daily life has been inextricably linked with the machine. So I chose the field of Place and Technology and Personal Space to explore.
2. Collect Data
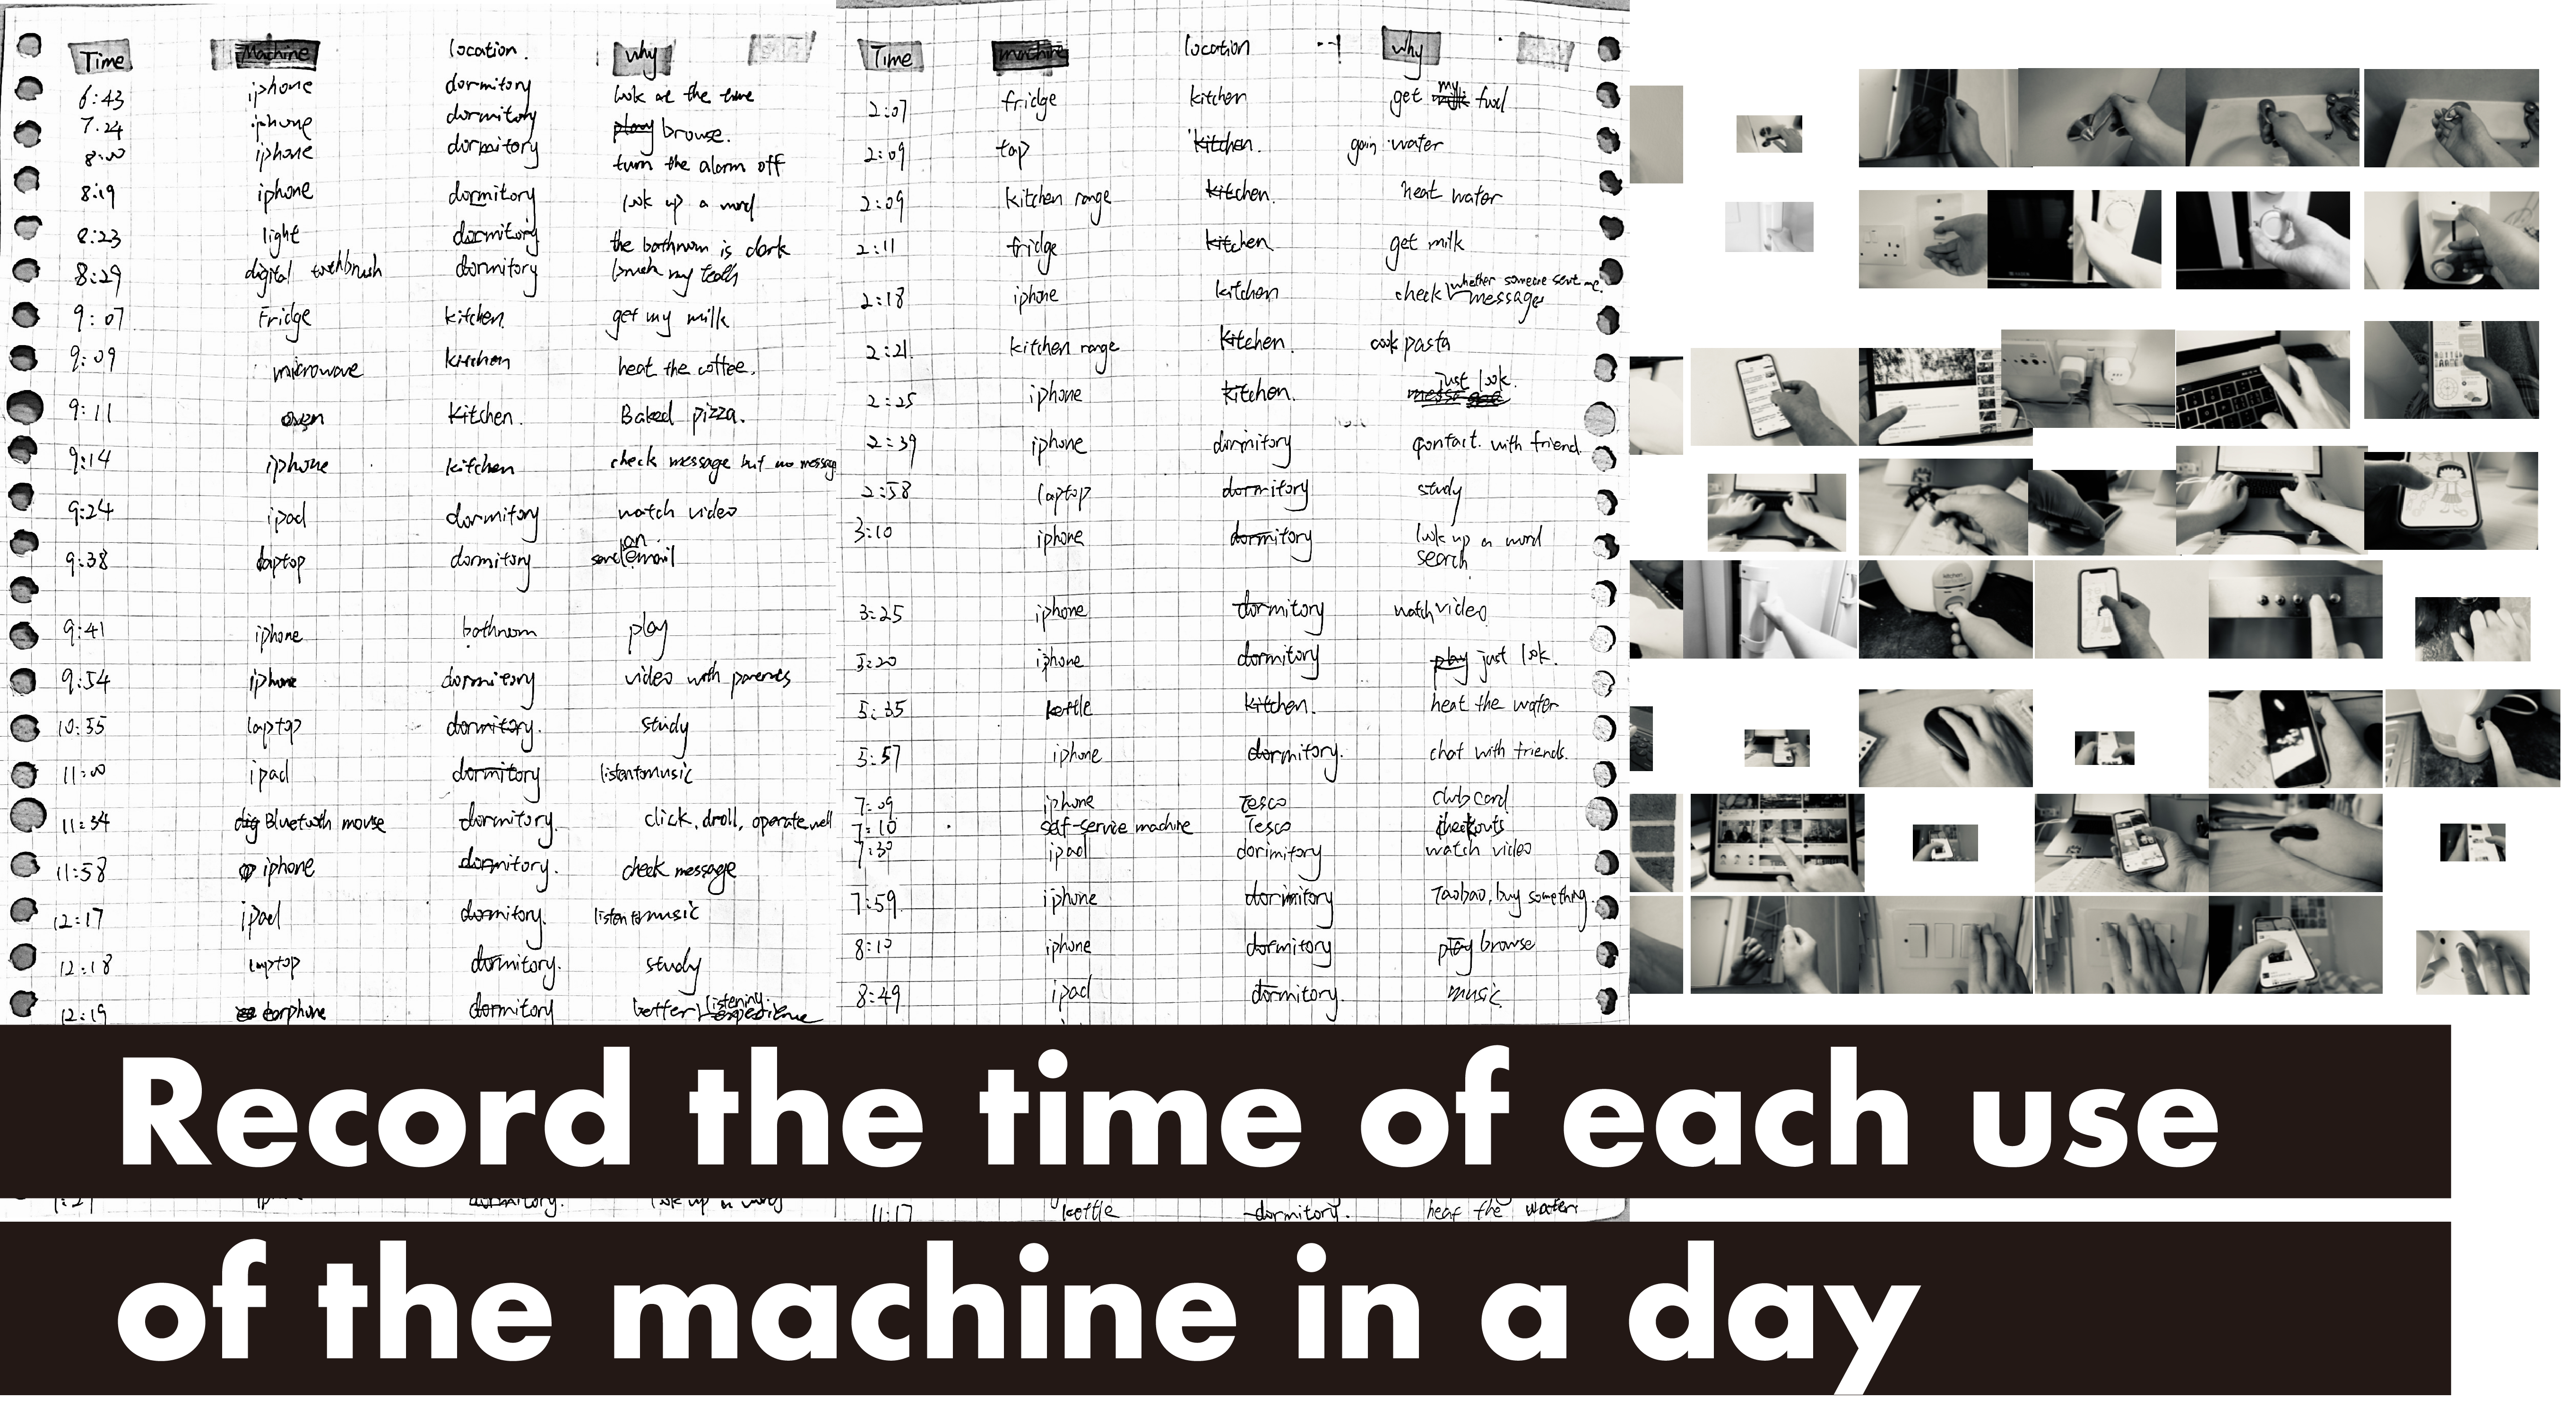

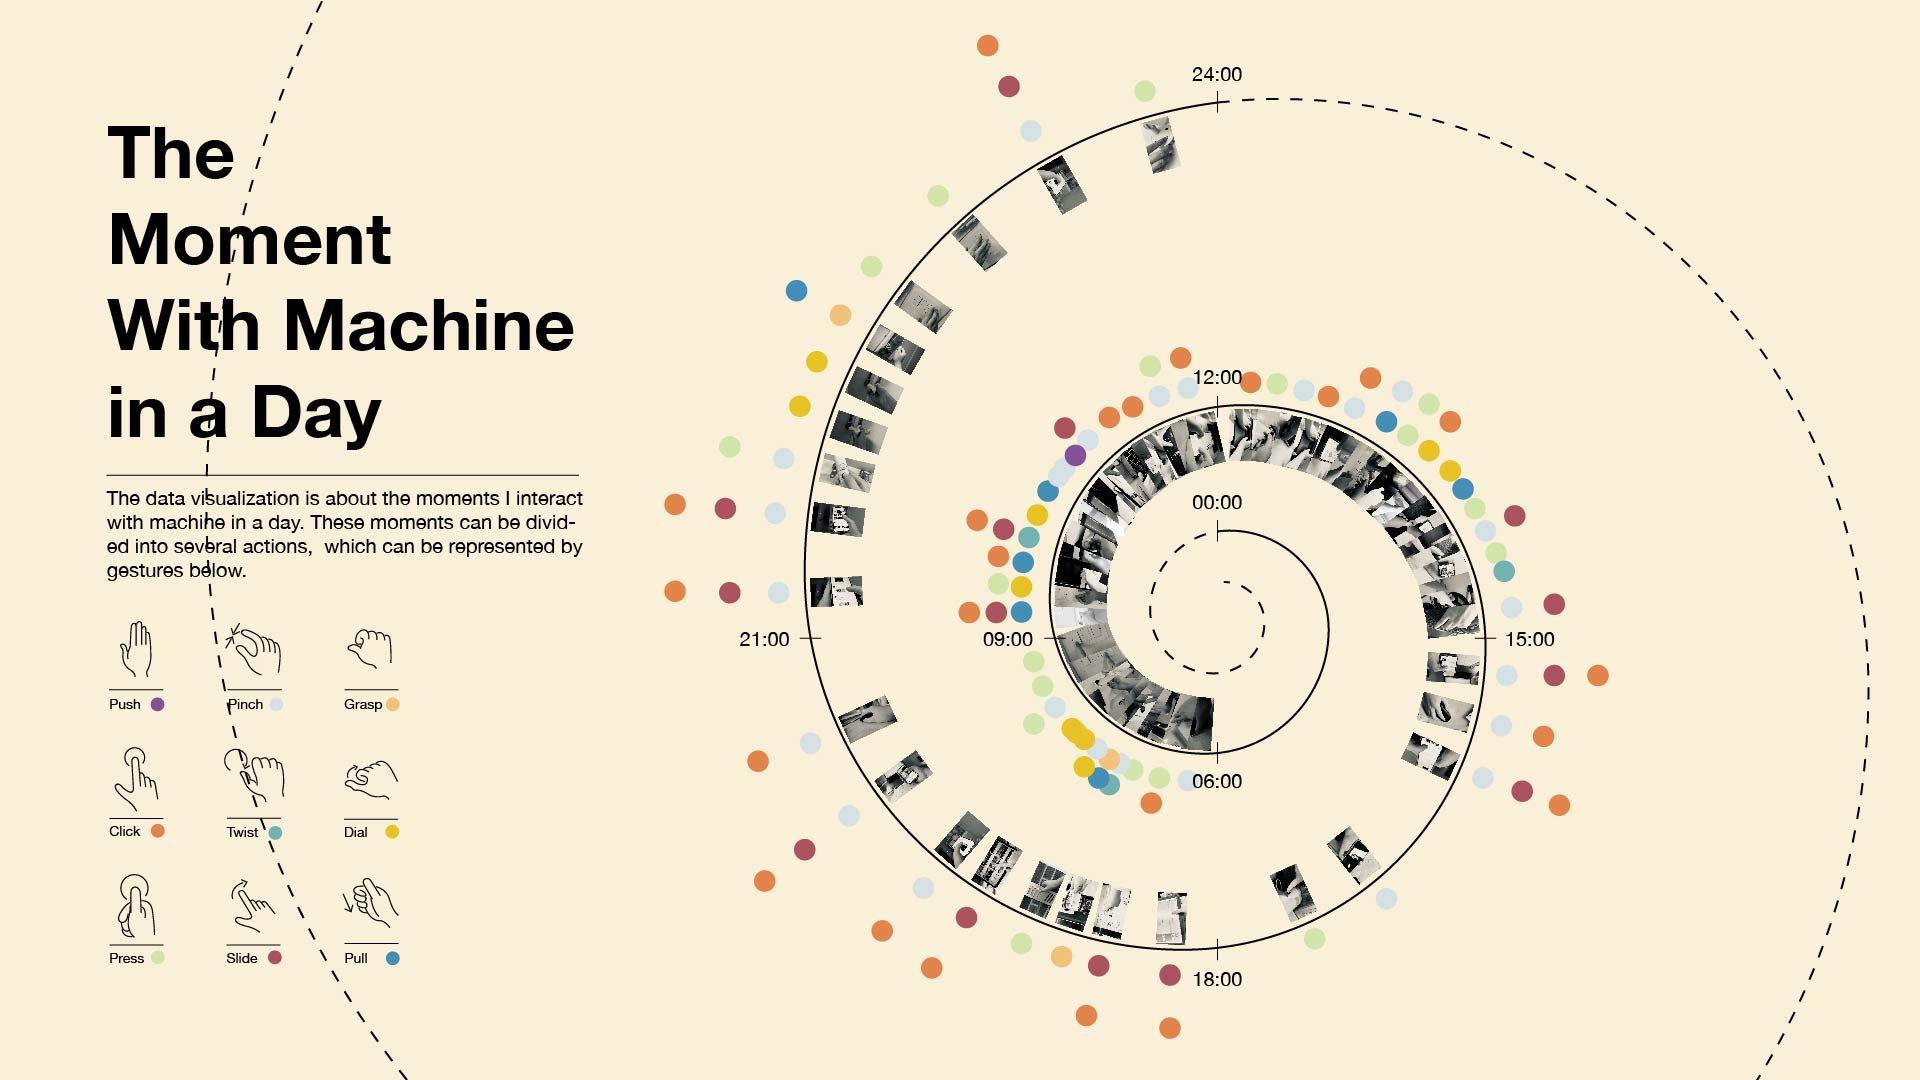
I recorded the time, machine, location, and reasons for each time when I use the machine in a day. Otherwise, I also photographed the moments that I get touch with these machines and listed them according to the time.
3. Analysis
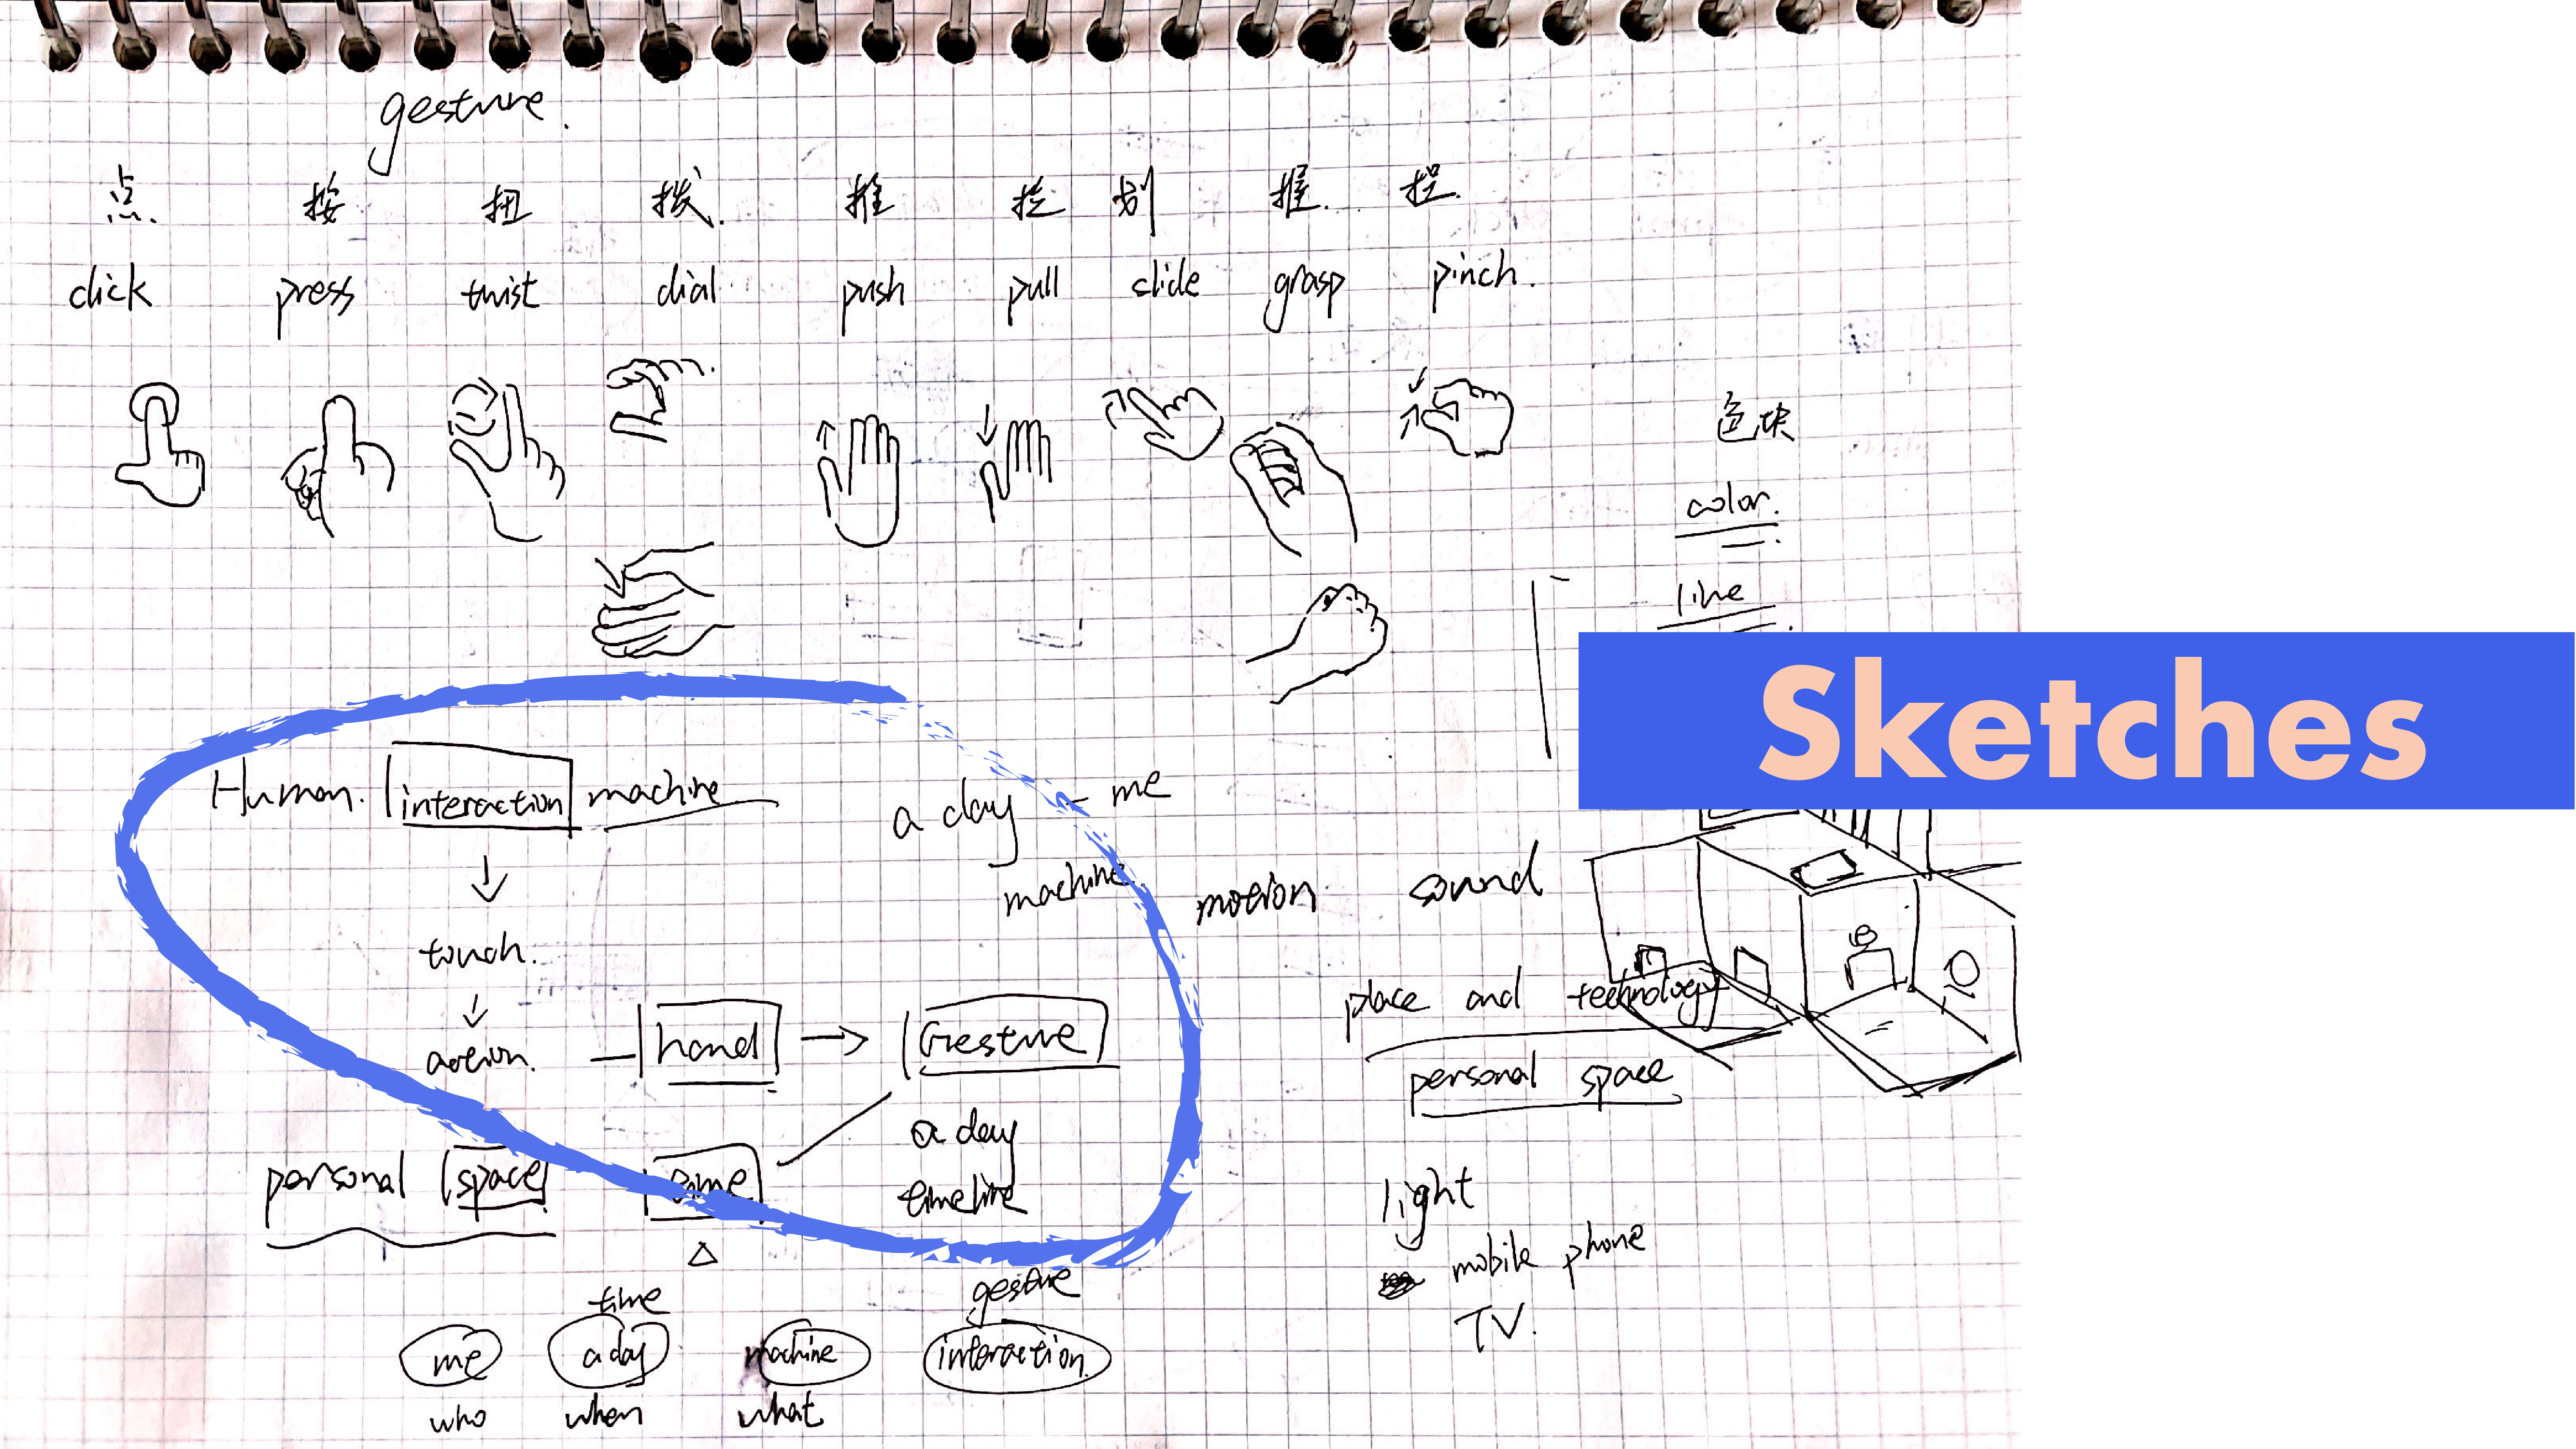
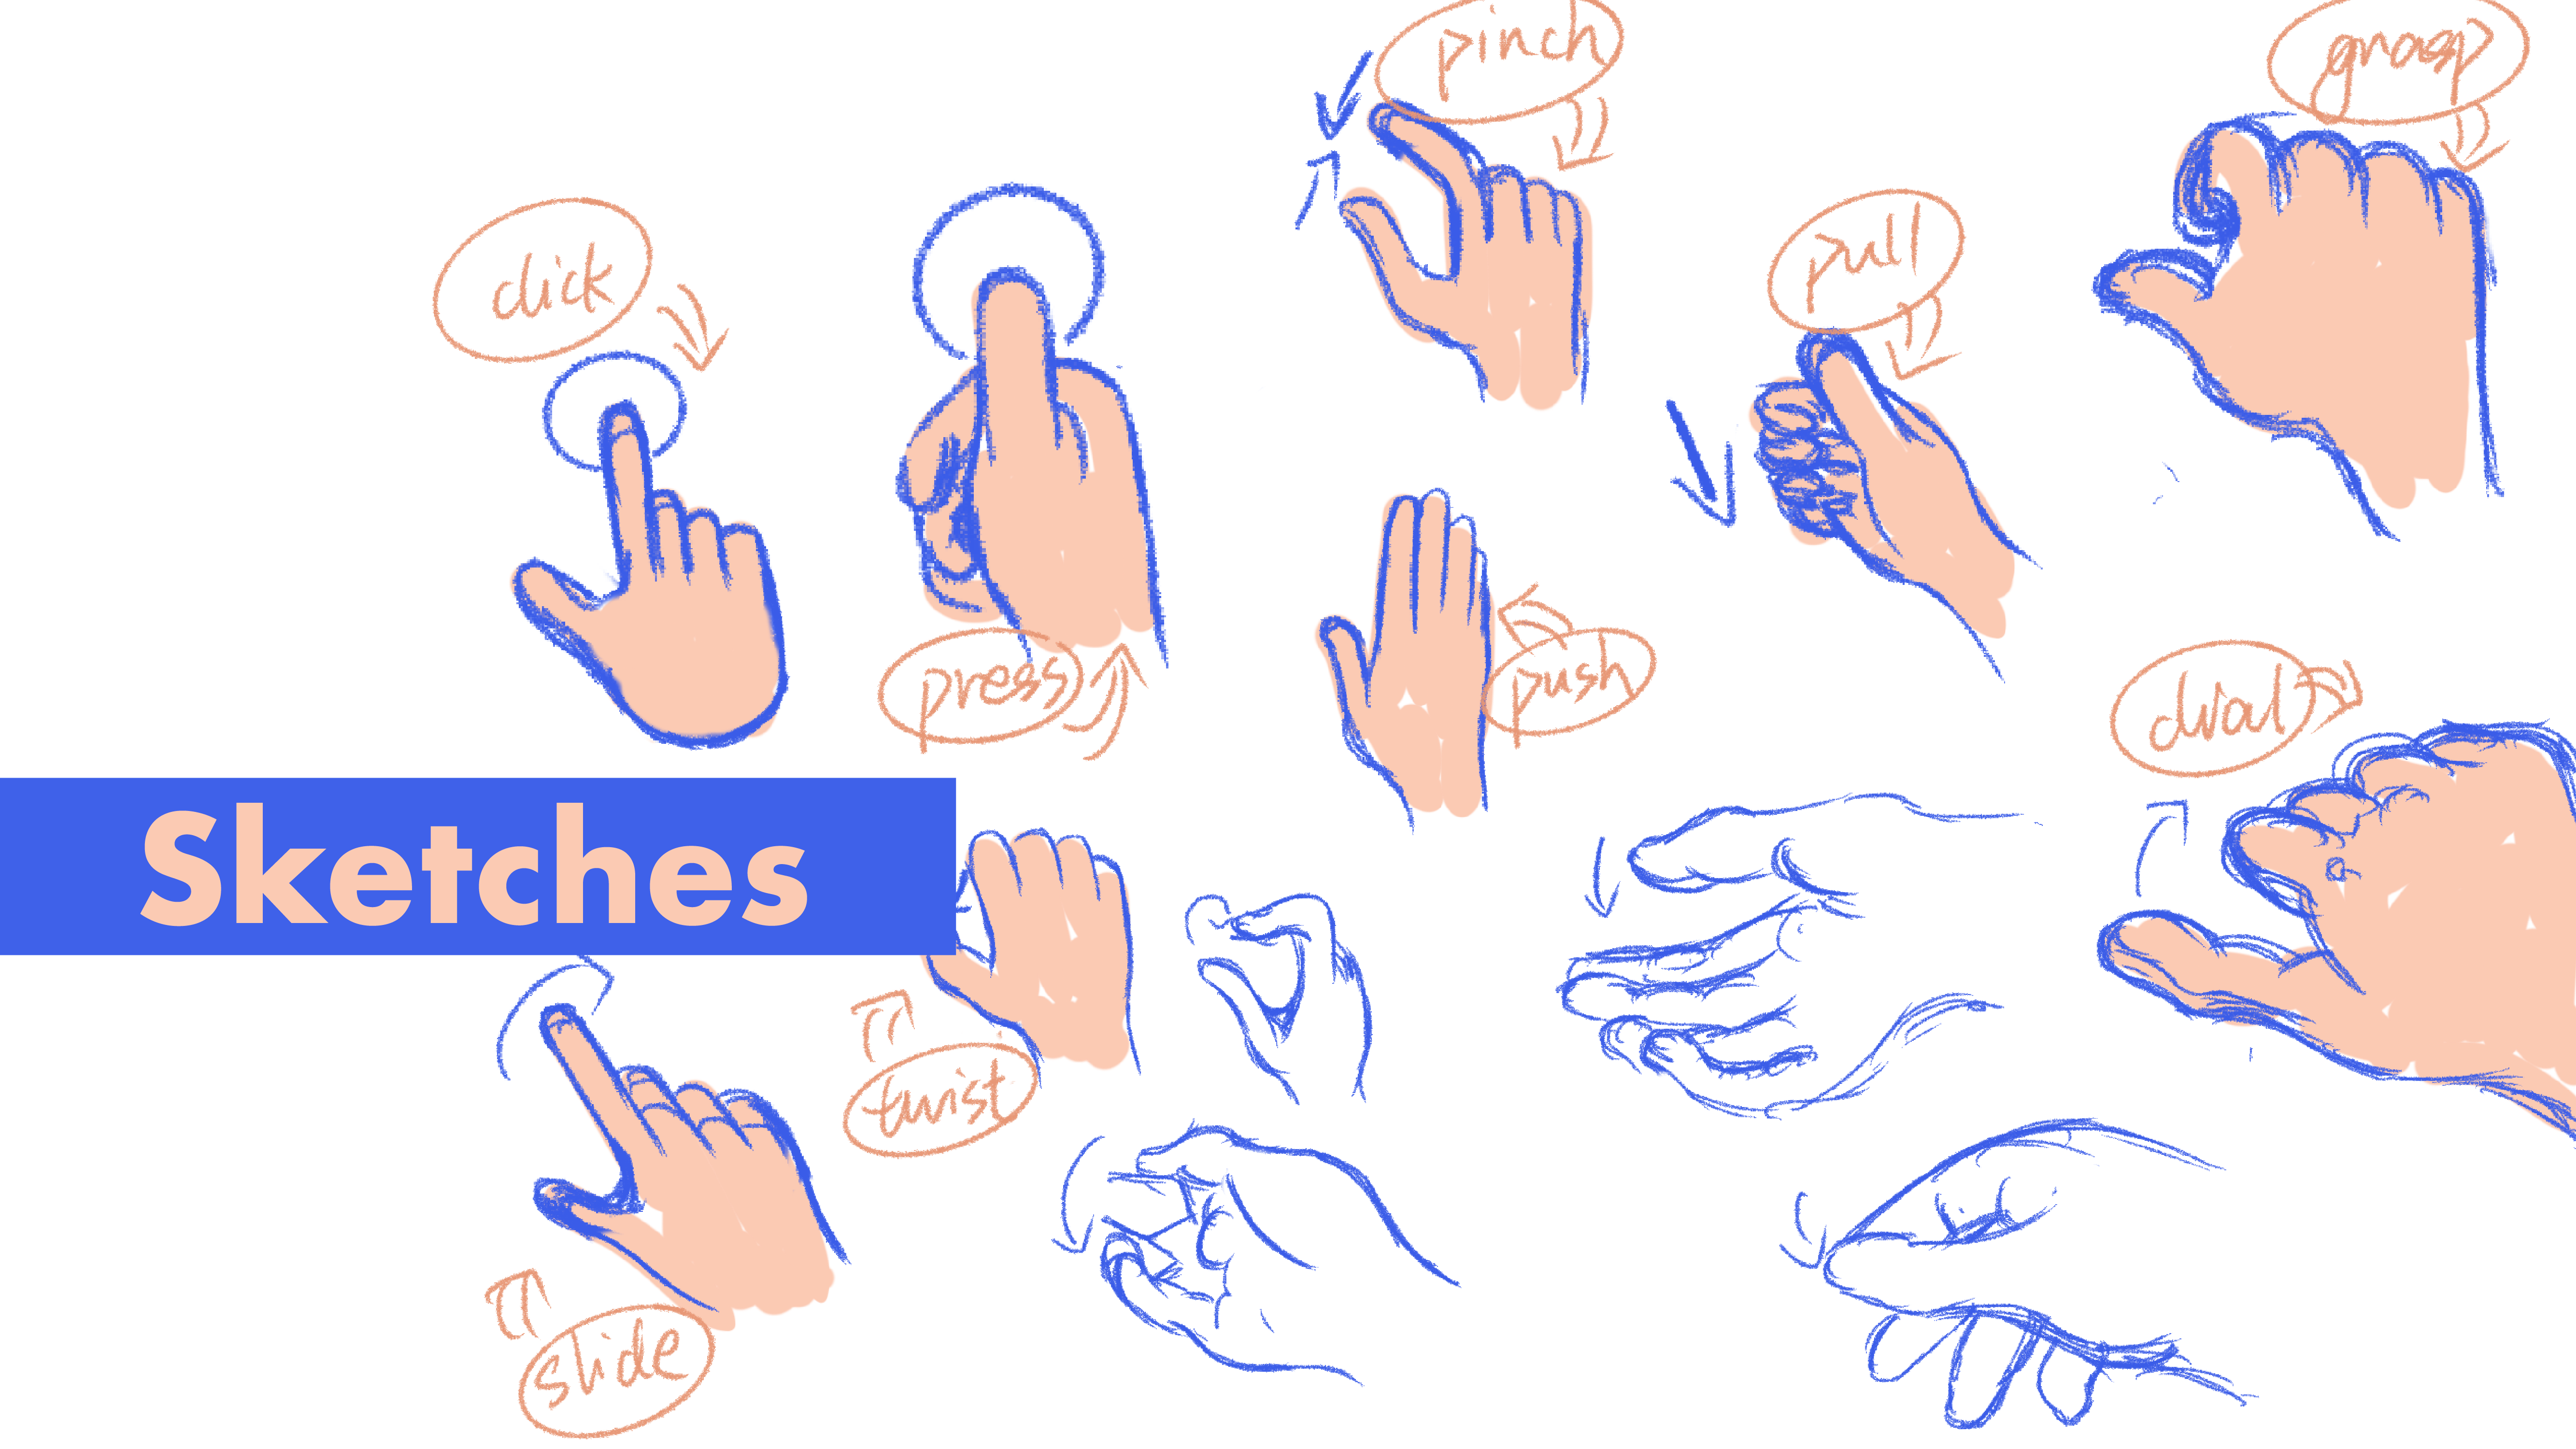
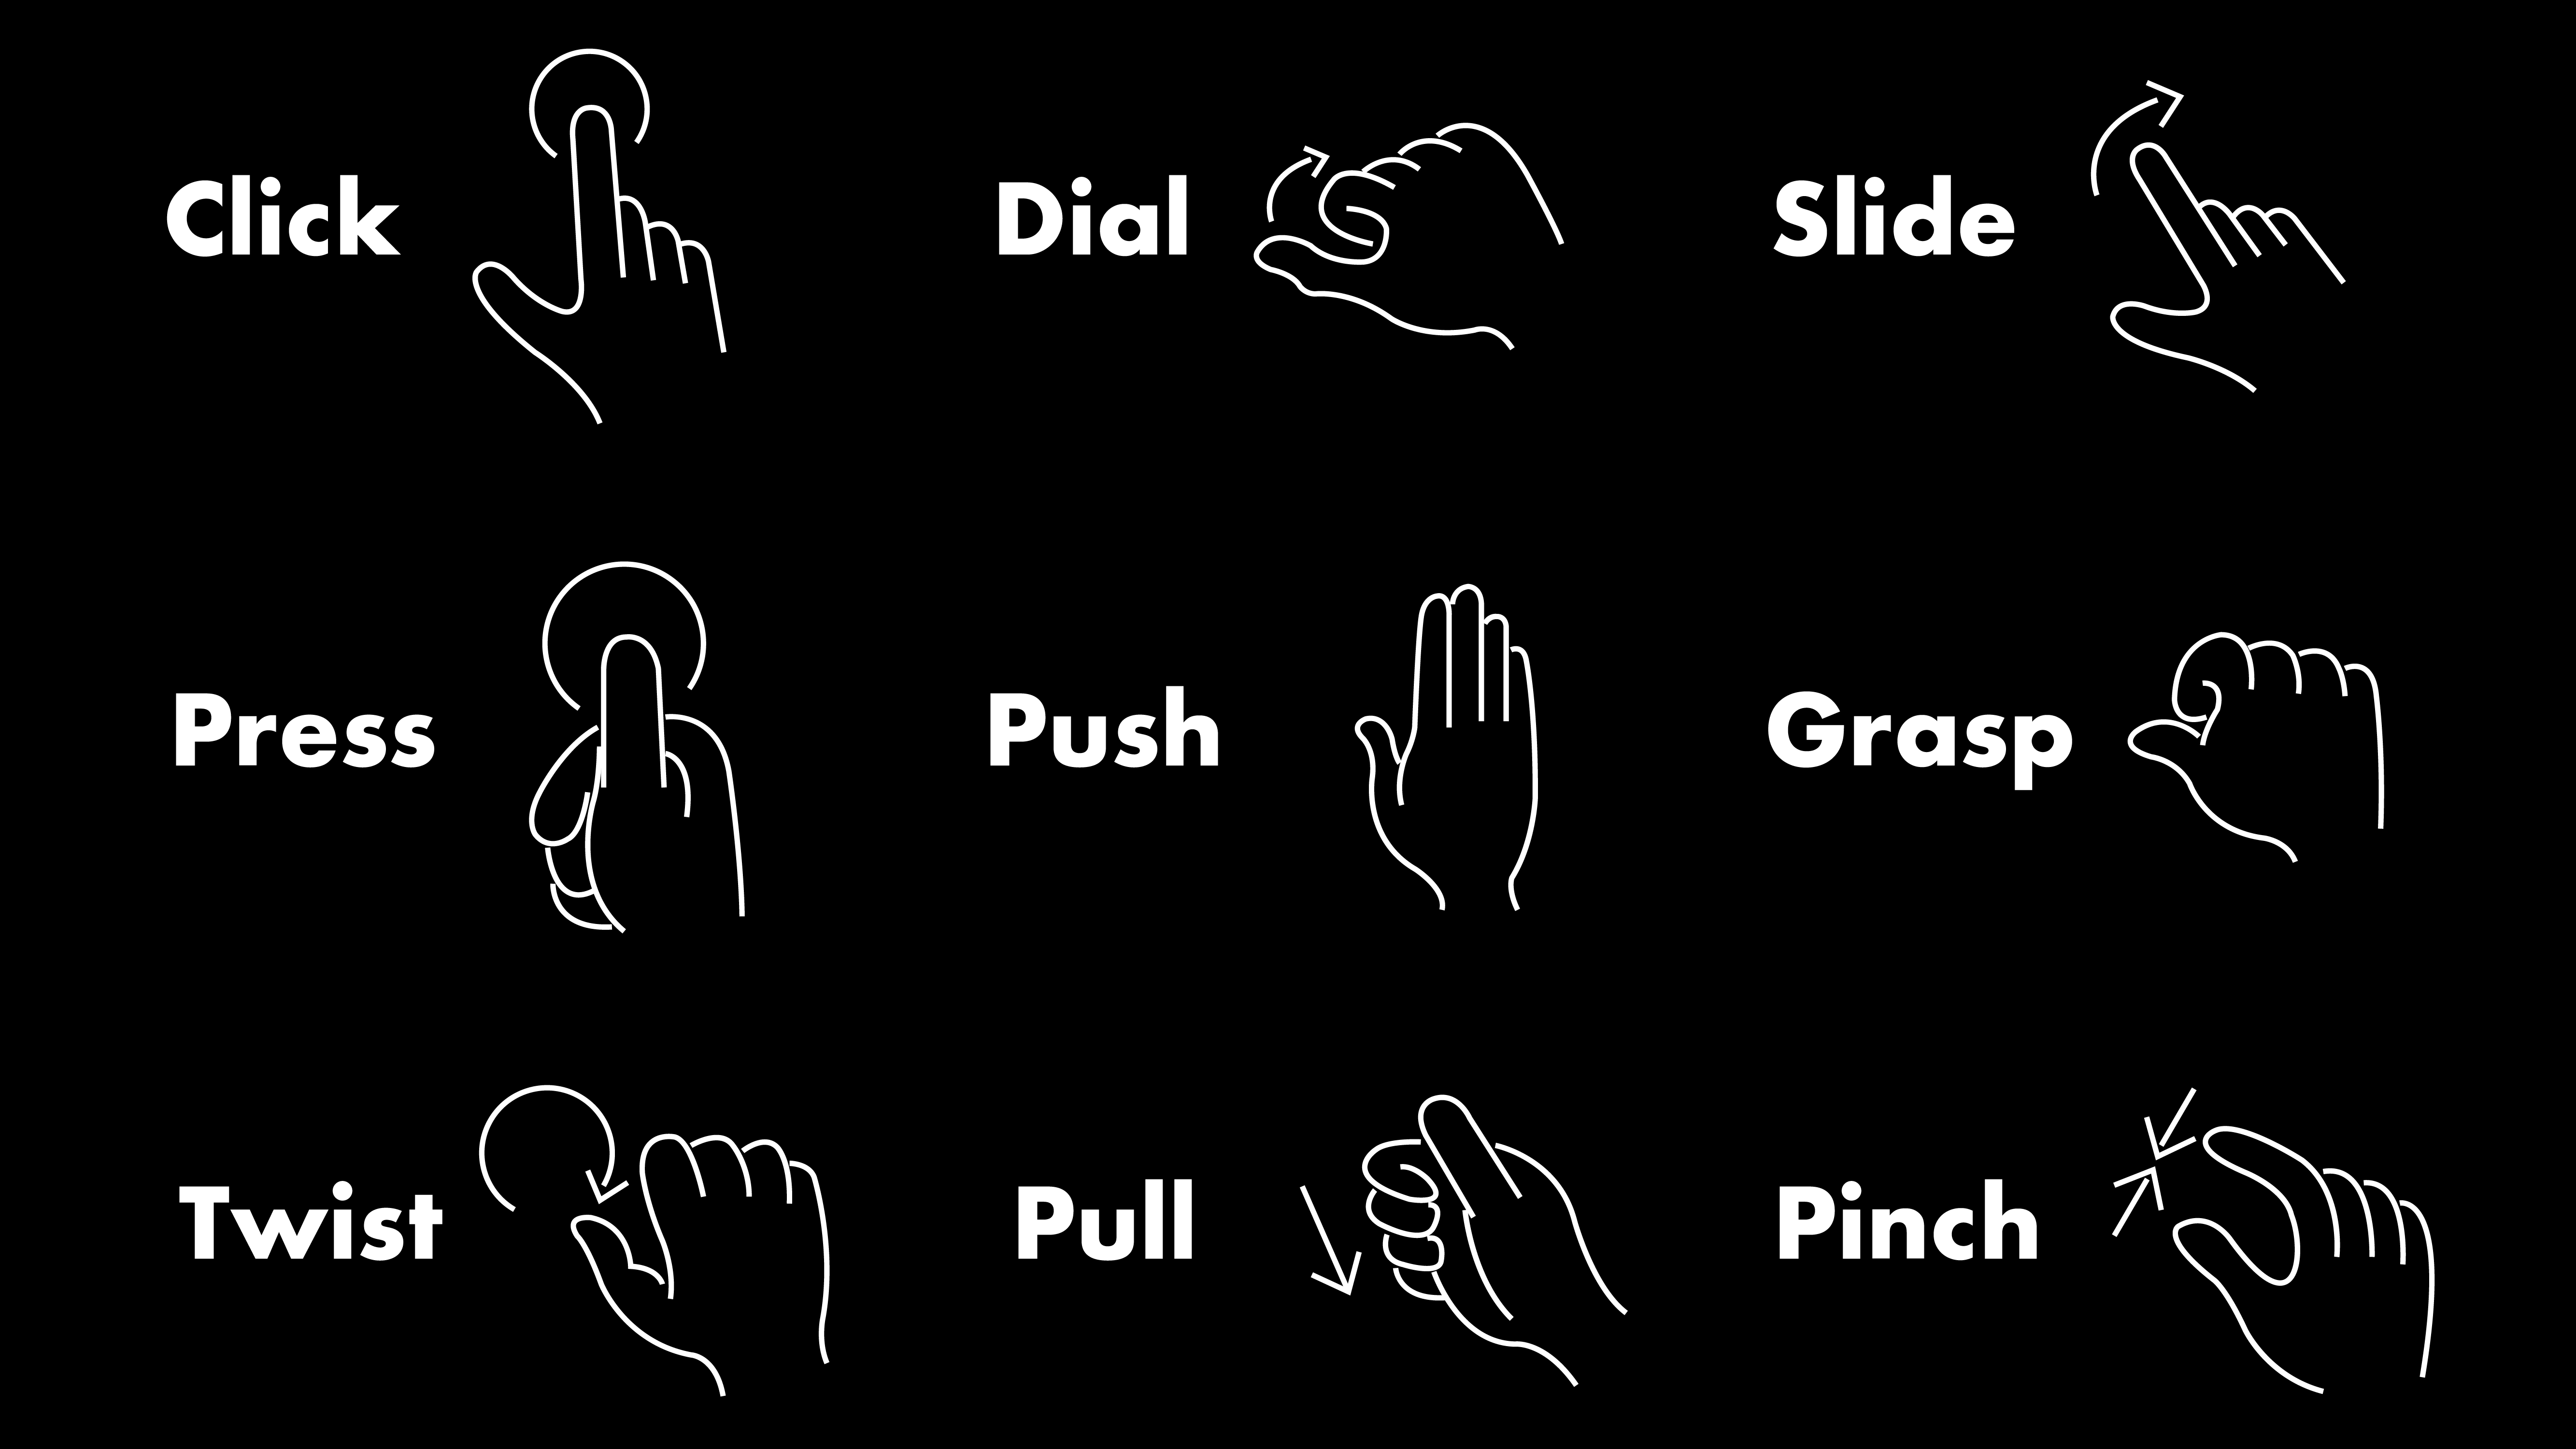
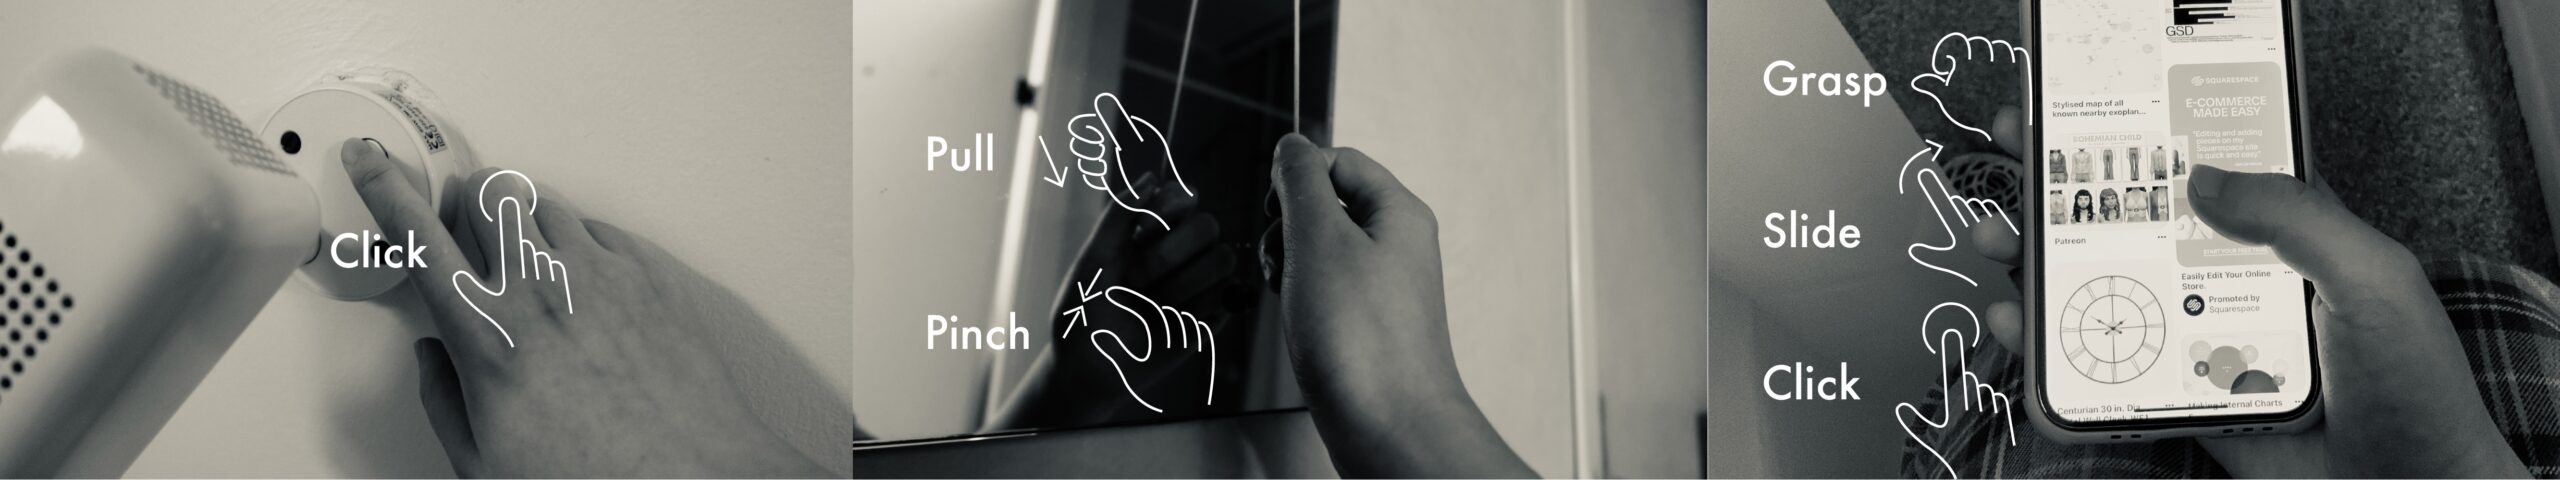
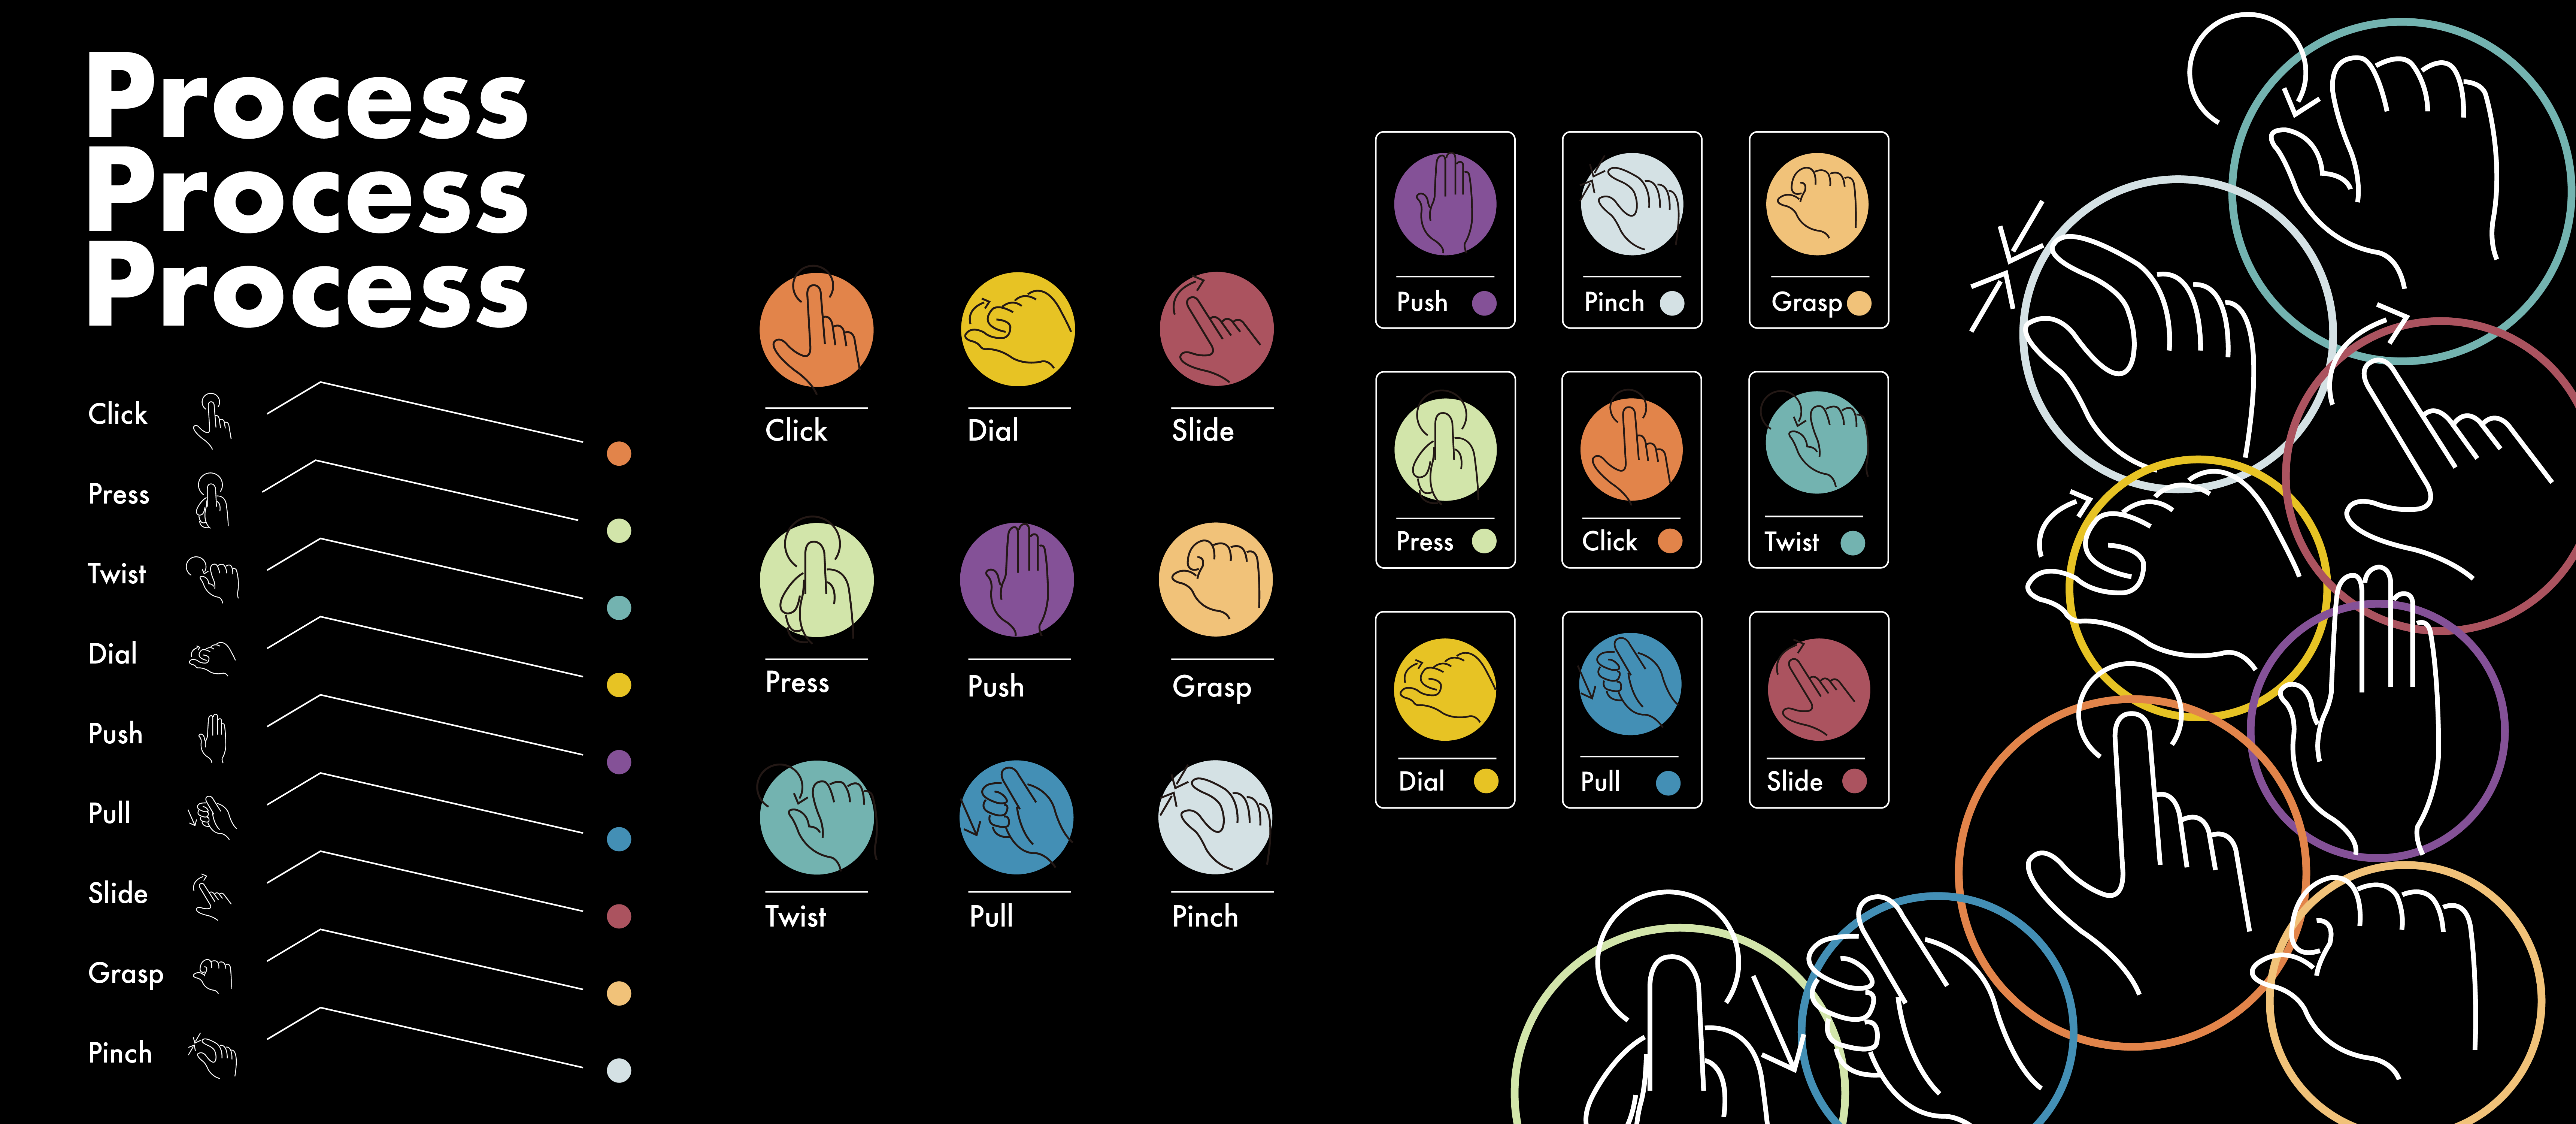
Every time I interact with these machines, I need to use my hand to touch first and then make the next action. And every action can be divided into several gestures to express. Through observing and analyzing, I found that there are about nine gestures that can generalize most of my interactions with these machines.
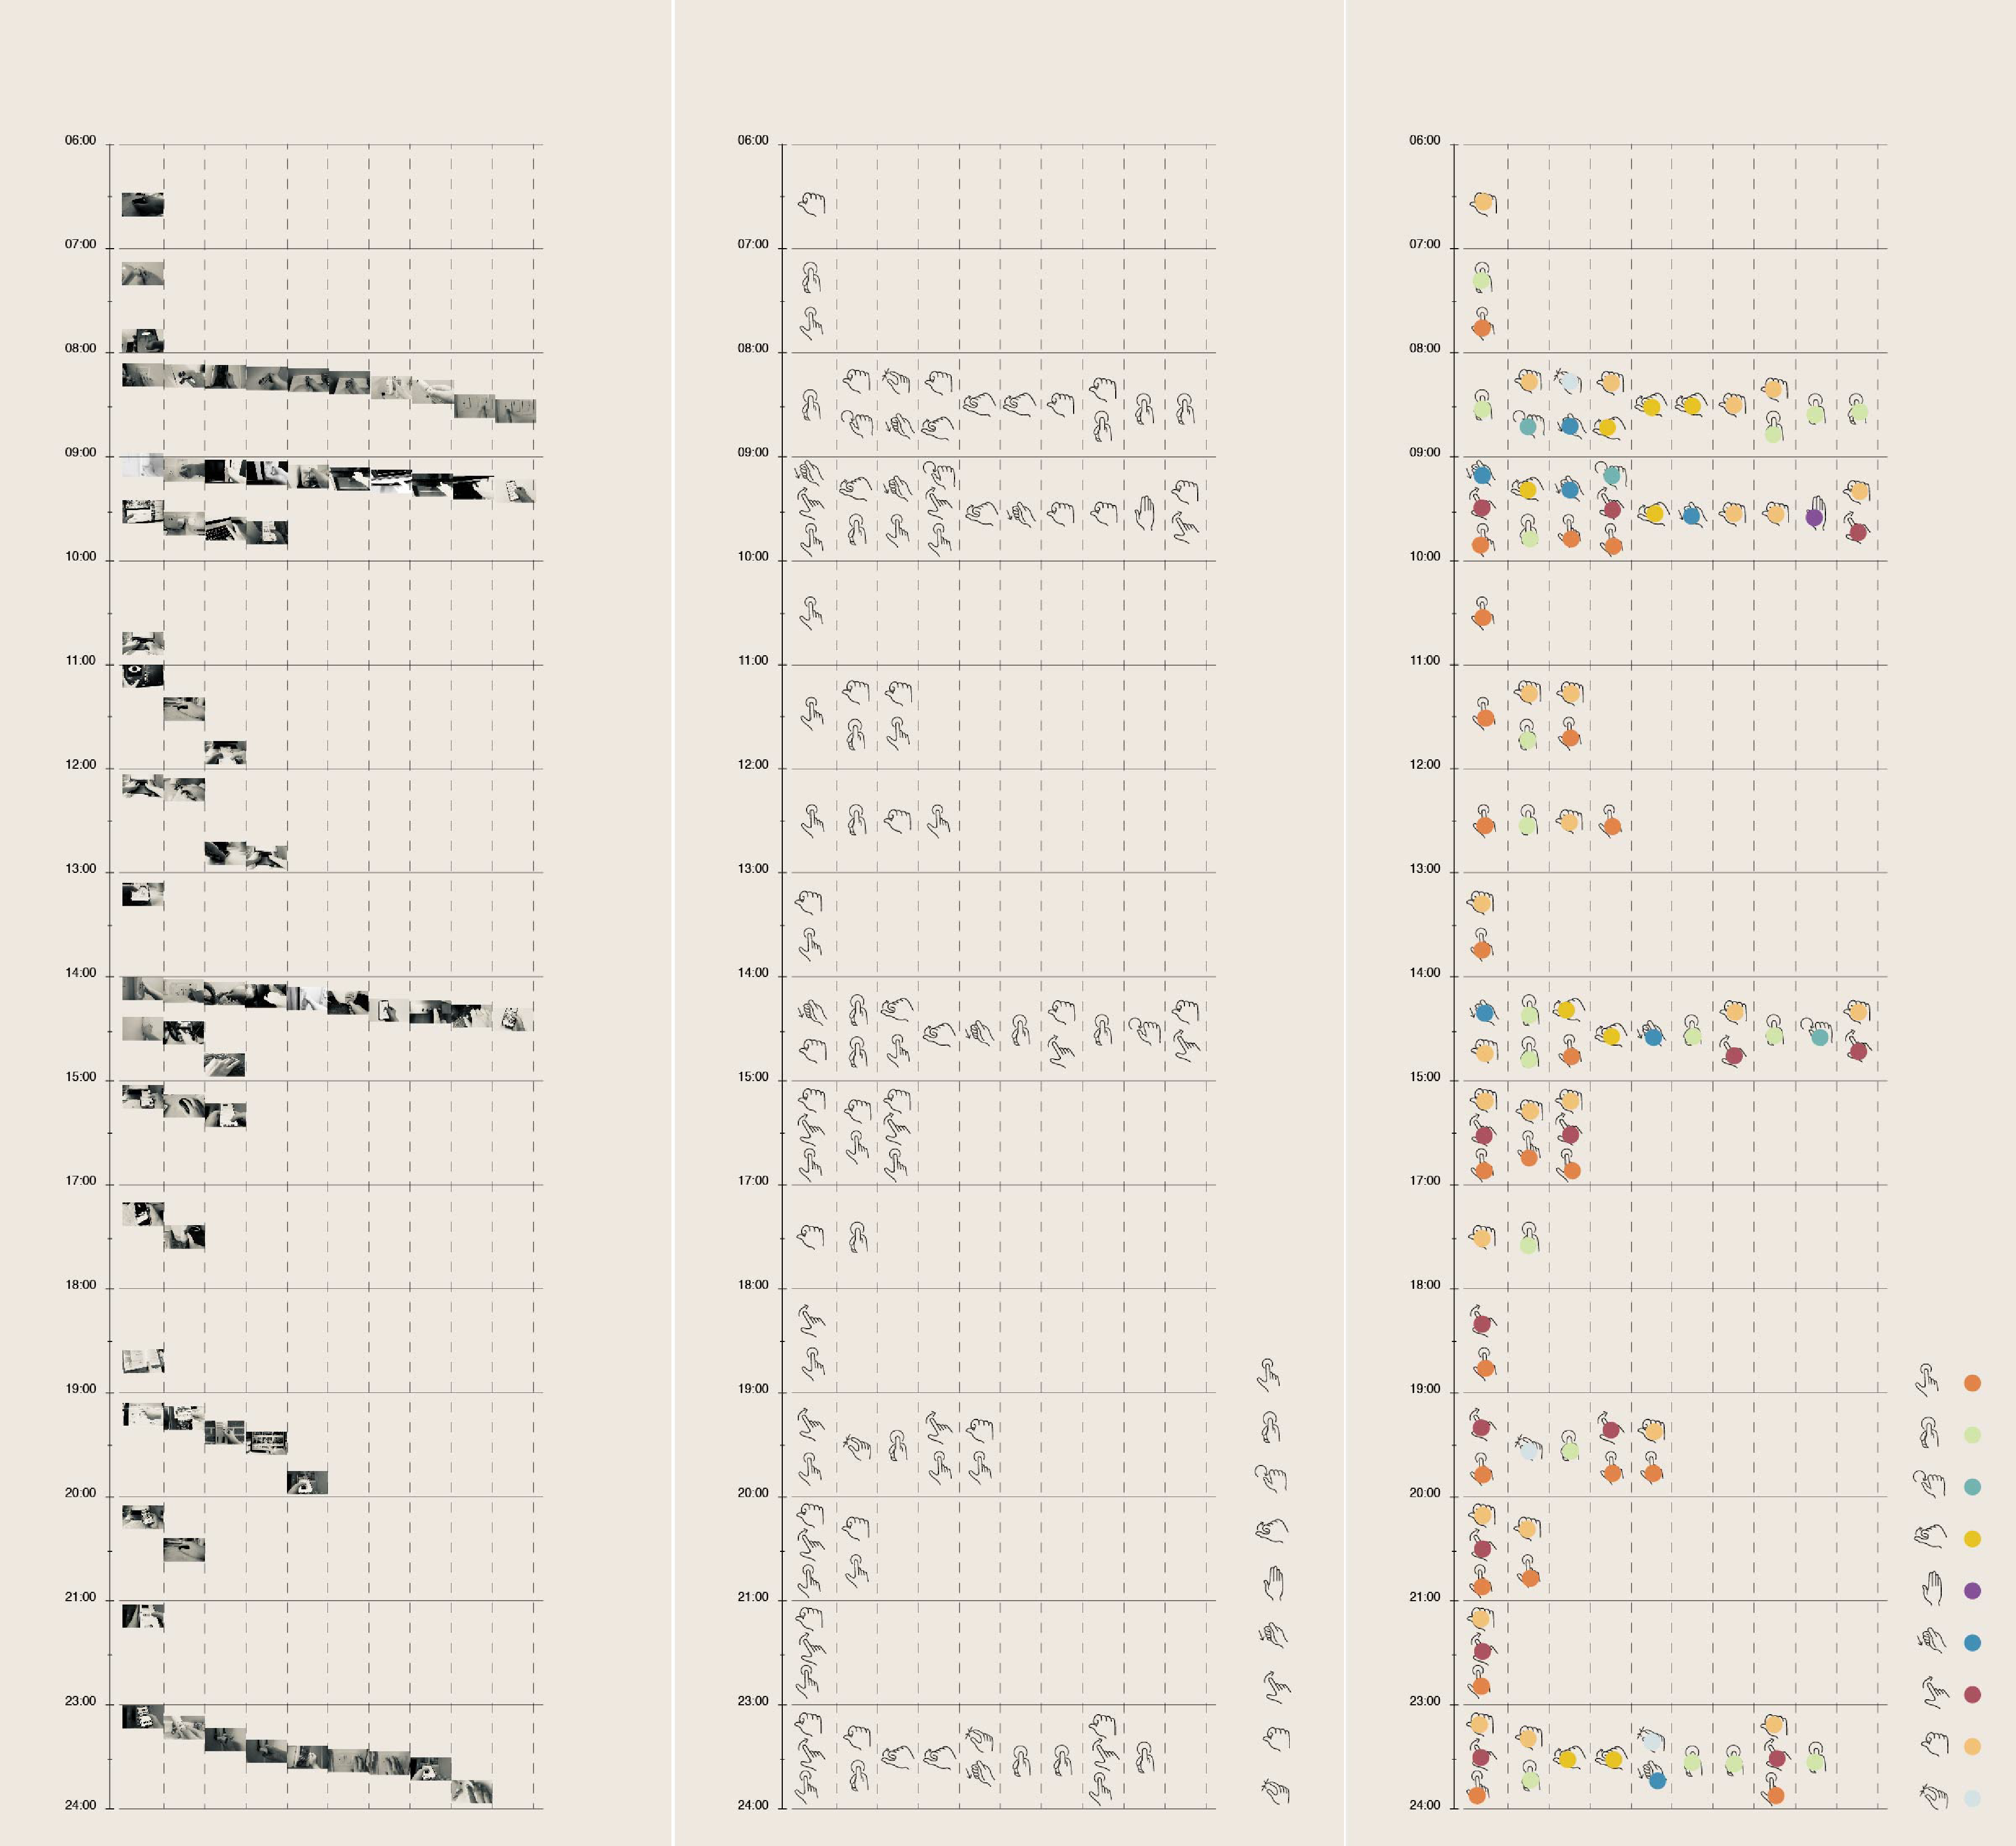
4. Visualization
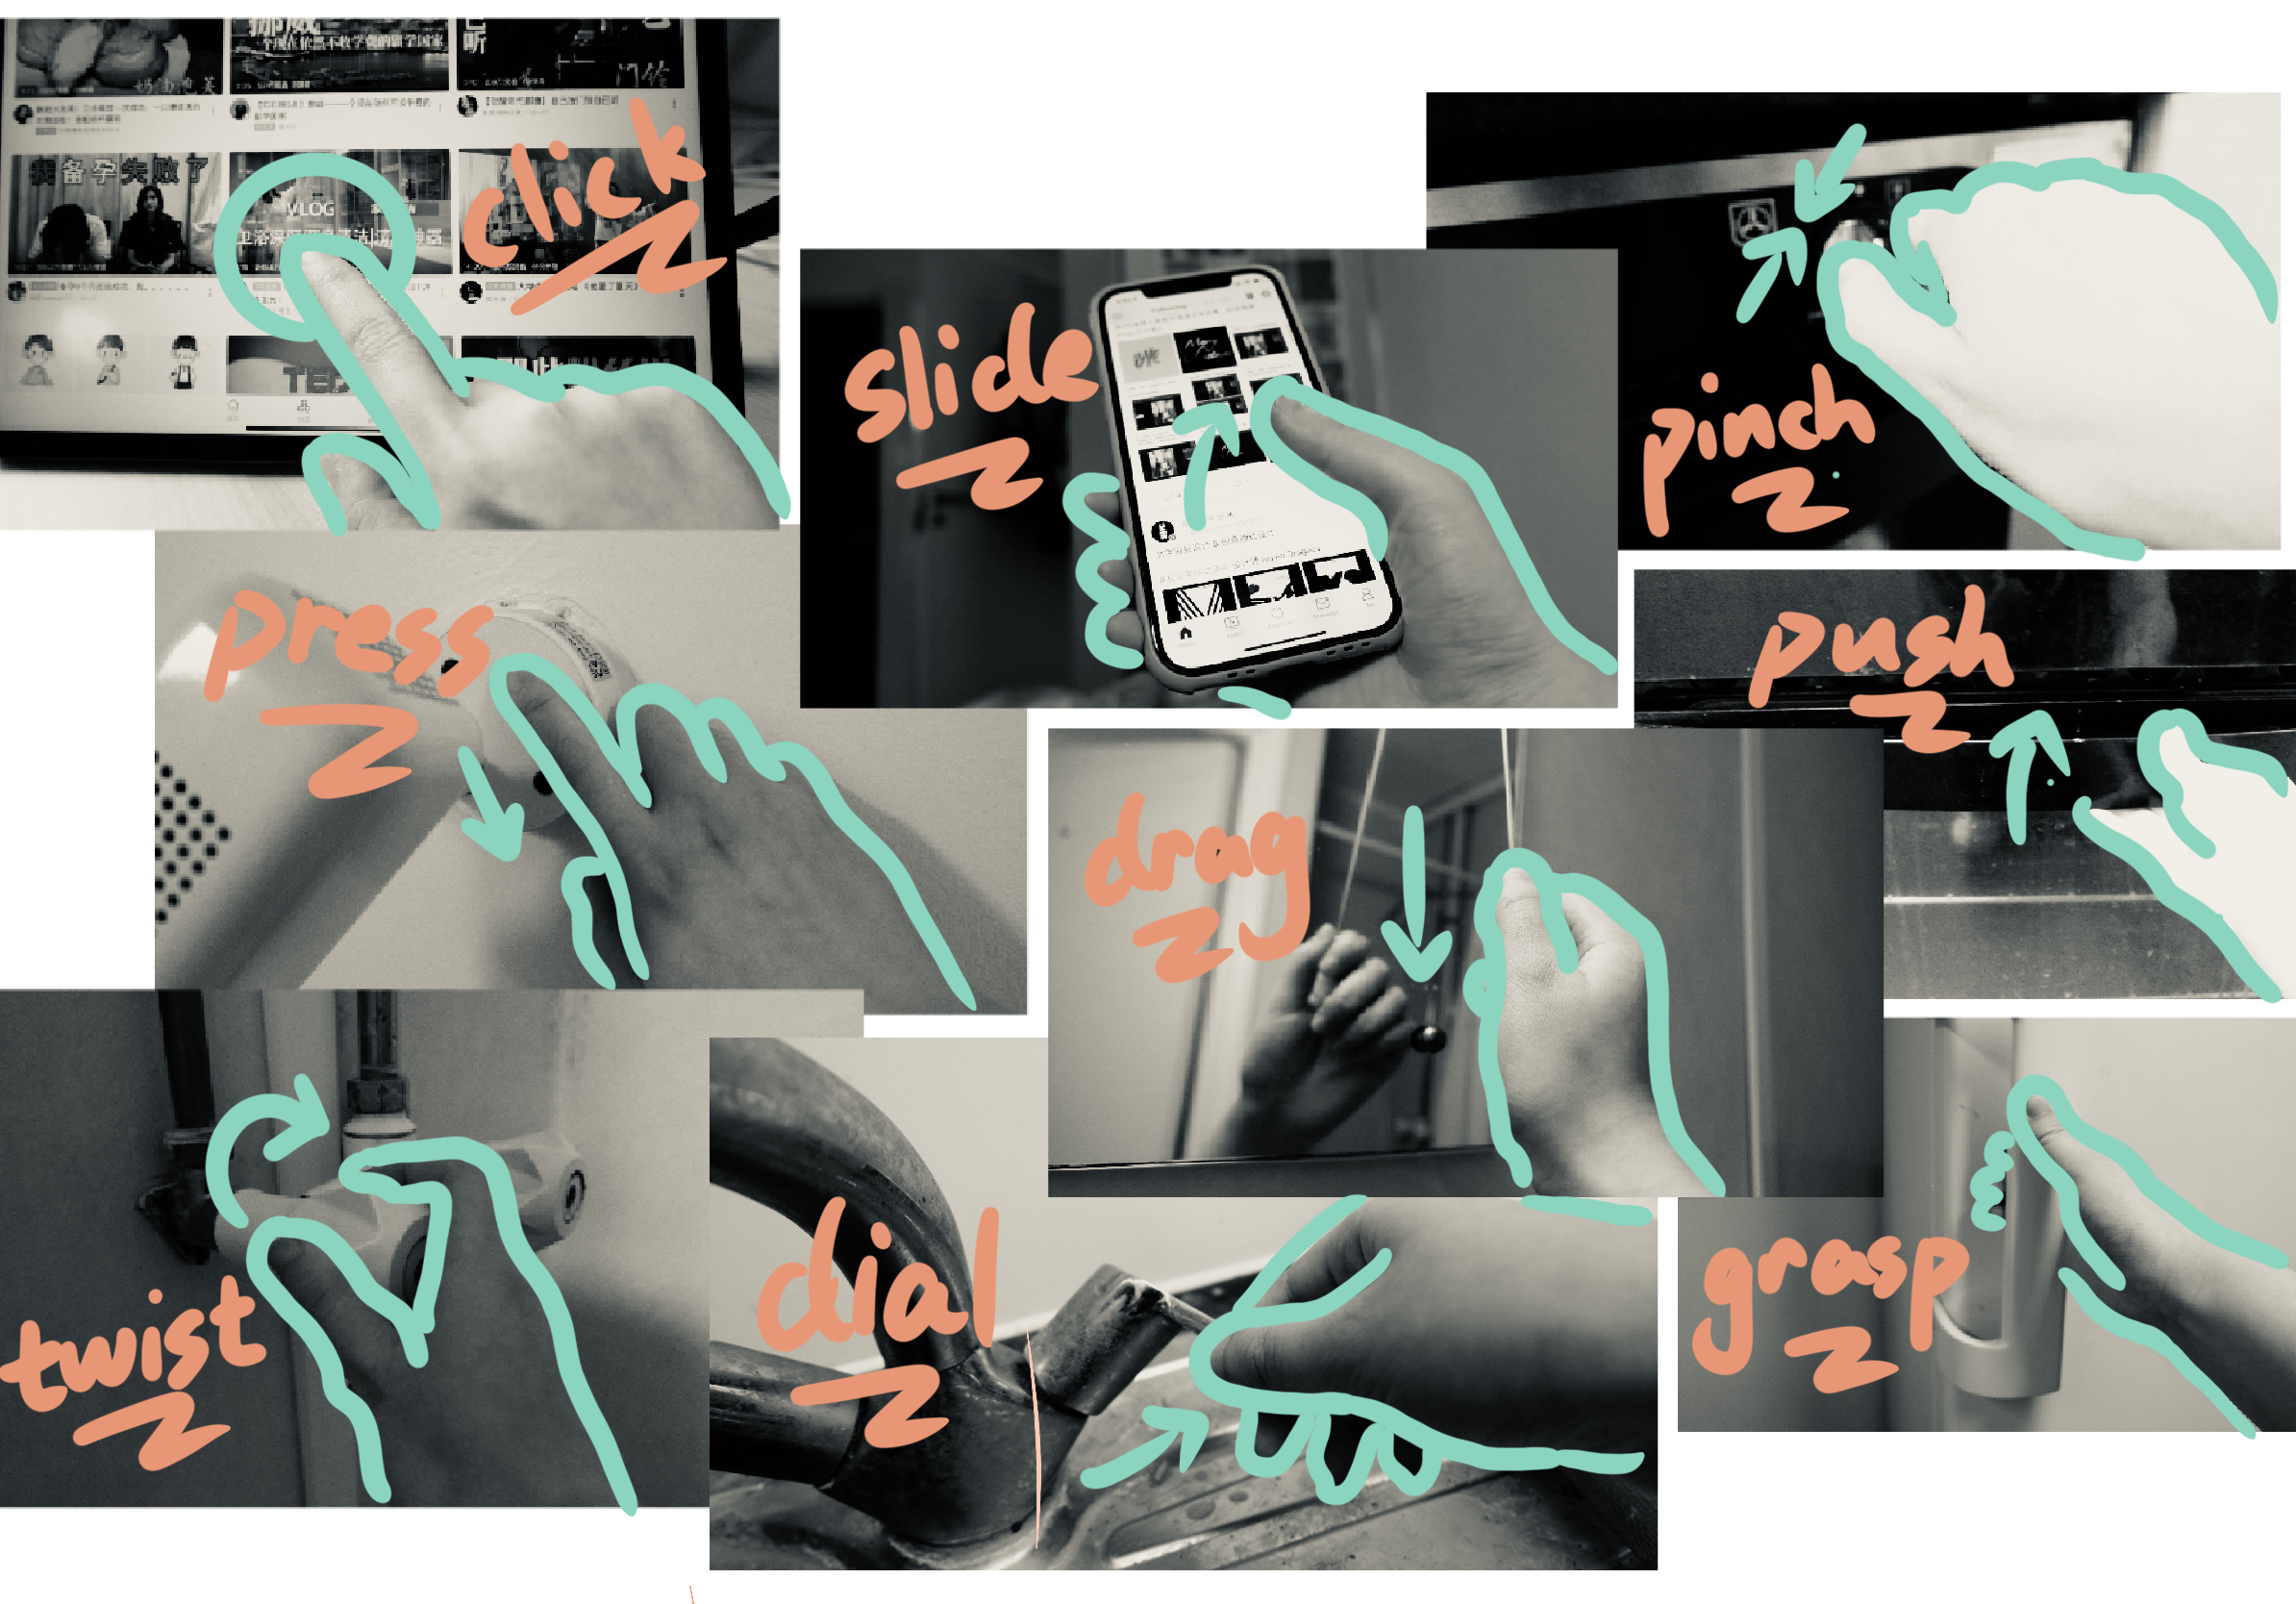
I listed the photos of these moments according to the timeline and divided every interaction into several gestures. But the icon of these gestures are not clear enough to show these interactions, so I use different colors to represent these gestures.
5. The Final One
6. The Final Two
Every time I make an action, and these machines will give me different sound feedback after I interacting with them. For example, there will be a sound of water flowing when I turn on the faucet and there will be a wind sound when I turn on the range hood. The characteristics of these sounds are all different, so I also visualized these sound feedbacks.
https://www.youtube.com/watch?v=Pti0_ycFBP4https://www.youtube.com/watch?v=r9lFAPHMLuM